
ML Case-study Interview Question: Solving Cold Start Restaurant Ranking with LambdaMART


Browse all the ML Case-Studies here.
Case-Study question
You are asked to design a machine learning system to rank restaurants for new users on a major online food delivery platform. The system needs to address the cold start challenge where no user interaction data is available. The objective is to rank restaurants so that newly onboarded users see the most relevant options first and are more likely to order from them. How would you build such a solution from the ground up, and how would you evaluate its performance and iterate upon it?
Detailed Solution
Understanding the Cold Start Context
New users lack historical interaction data. Collaborative filtering often fails because it relies on user-item interactions from previous sessions. A content-based approach works better: it uses item (restaurant) attributes and known aggregate signals from other users. Think about popularity, location, average preparation time, and other factors that might matter to a fresh user.
Baseline Model
A baseline helps test end-to-end feasibility quickly. One simple approach relies on:
Popularity: Could be historical order frequency or rating.
Distance: Acts as a proxy for delivery time and cost.
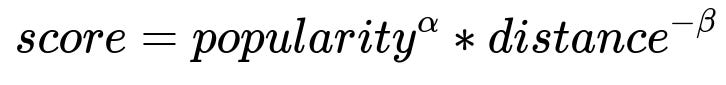
This baseline can be expressed as:
Where:
popularity is an aggregated metric like average orders or rating for each restaurant.
distance is the physical distance between user and restaurant.
alpha (a) and beta (b) are hyperparameters controlling how popularity and distance affect ranking.
Optimizing alpha and beta can be done via backtesting. Gather historical sessions, apply different (alpha, beta) pairs, compute a ranking for each session, track the rank of the actually ordered restaurant, and measure an aggregated ranking metric such as NDCG.
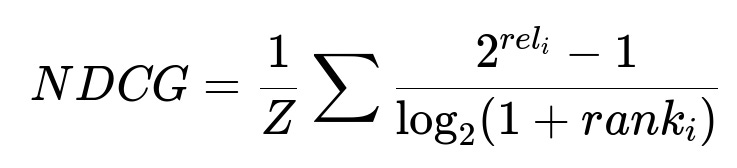
Where:
rel_i is the relevance of the restaurant at position i in the list (1 if ordered, 0 otherwise in this scenario).
rank_i is the position in the ranked list.
Z is a normalization factor ensuring the value ranges between 0 and 1.
Keep alpha and beta that yield the best average NDCG during backtesting.
Scaling Up with Learning-to-Rank (LambdaMART)
A purely linear relationship between popularity and distance can be limiting, especially if you have more features (cuisine, average prep time, short-term popularity, etc.). LambdaMART extends gradient-boosted trees with pairwise ranking targets. It automatically learns interactions between features. Few transformations are needed because tree-based models can split on raw values.
Steps to deploy LambdaMART:
Compile training data with features relevant to each restaurant in a user’s context. Examples include average rating, short-term popularity, location, time of day, fees, etc.
Label a restaurant as 1 if it was ordered or 0 otherwise.
Train LambdaMART to optimize ranking metrics.
A/B test the new model in production to compare performance against the baseline. Track lifts in relevant metrics such as overall order rate, reorder rates, or NDCG on new user sessions.
Practical Implementation Insights
Combine relevant data sources. For instance, you might need user location data, historical restaurant performance data, or real-time signals like current prep times. Ensure the system remains fast enough for production: ranking must happen quickly when new users open the platform.
When new users sign up, the model predictions default to content-based signals until additional interactions (clicks, orders, browsing patterns) are available. Over time, you can move from this cold start approach toward a more personalized, collaborative filtering approach.
Example Python Snippet
Below shows a hypothetical outline for the baseline approach (popularity^alpha * distance^-beta):
import numpy as np

def calculate_score(popularity, distance, alpha, beta):
    return (popularity ** alpha) * (distance ** (-beta))

# Example usage:
restaurants = [
    {"id": 1, "popularity": 100, "distance": 2.5},
    {"id": 2, "popularity": 50, "distance": 1.0},
    {"id": 3, "popularity": 120, "distance": 4.0},
]

alpha = 1.0
beta = 1.2

for r in restaurants:
    r["score"] = calculate_score(r["popularity"], r["distance"], alpha, beta)

ranked = sorted(restaurants, key=lambda x: x["score"], reverse=True)
print(ranked)
Adjust alpha and beta based on backtested performance using historical data.
Follow-Up Questions
1) How would you handle missing or noisy data for features like popularity or delivery distance?
In many real-world situations, data might be incomplete. Some restaurants might be too new to have stable popularity data. You could:
Default to global averages where data is missing.
Use partial data from similar restaurants to impute missing values.
Treat missing data as a separate category in the model.
Noisy data can be handled by:
Capping extreme outliers.
Maintaining robust data pipelines that automatically validate input ranges.
Employing smoothing in features like popularity, for instance using popularity = (orders + smoothing_factor) / (time + smoothing_factor) to avoid zero or undefined values.
2) Why not just always rank by popularity or always rank by shortest distance?
Pure popularity-based ranking might overpromote a small subset of restaurants, overlooking the variety new users may prefer. Shortest distance alone ignores taste and quality. Overfitting to any single criterion can degrade the user experience. Balancing multiple features through a well-designed model offers more nuanced recommendations.
3) How do you decide on the final evaluation metric for the ranking system?
NDCG is a typical choice for multi-position rankings because it captures both position relevance and whether the user eventually orders. Other metrics could include mean reciprocal rank (MRR) or top-K accuracy. The best choice depends on your platform’s primary success metric. For example, if immediate orders matter most, NDCG is a strong fit. If you only care whether the correct restaurant is top-1, MRR or top-1 accuracy might suffice.
4) Why choose LambdaMART over simpler algorithms?
LambdaMART excels in:
Handling large feature sets with minimal manual transformations.
Capturing non-linear relationships automatically.
Directly optimizing ranking objectives. It outperforms simpler linear approaches when your features have complex interactions.
5) How do you generalize the approach from new users to returning users?
When returning users come back, you can blend collaborative filtering or user-specific patterns. For instance, a hybrid approach might have a weighted mix of content-based scores and user-personalized scores. Over time, incorporate more personal data (previous cuisines, times of day they ordered) to fine-tune restaurant rankings.
6) If a new user interacts with the system, how quickly would the model adapt to their actions?
Short-term signals like clicks and orders can feed into a real-time or near-real-time layer. One approach is a fallback: if not enough data exists, default to the cold start ranking. As data accumulates, shift to a more personalized model. Streaming pipelines or micro-batch updates can help the system adapt within minutes or hours.
7) How do you ensure model stability in production, especially when new features or hyperparameter changes are introduced?
Use continuous A/B testing or incremental rollouts. Introduce new features or updated hyperparameters to a small portion of traffic initially. Compare key performance metrics to a control group. If metrics worsen, roll back changes and investigate. This iterative testing ensures no major disruptions to the user experience.
8) Could you add business constraints, like pushing certain partner restaurants higher for promotional deals?
Yes. Weight these constraints in the final score or treat them as additional features. For example, if a restaurant has a promotional deal, you can add a positive bias to that restaurant’s final ranking score. Implementation depends on how strongly you want to promote them relative to user preference. Real-time recalculation ensures the promotional effect lasts only as long as the campaign runs.
9) How do you handle seasonal patterns or sudden spikes in demand for certain cuisines?
Incorporate time-based features or flags for seasonal events. Track short-term popularity in near-real-time. For example, if a big event drives sudden demand for a certain cuisine, the model can pick it up through elevated popularity signals and rank those restaurants higher.
10) What if the average prep time or short-term popularity changes during peak hours?
Plan a pipeline to refresh these features often. Quick pivoting is crucial in a food delivery context. A scheduling system or streaming process can update relevant data (prep times, dynamic demand) every few minutes, ensuring the model predictions remain accurate.
All these considerations help deliver a robust ranking system that ensures new users see relevant restaurants, making them more likely to stay and enjoy the service.