
ML Case-study Interview Question: Reducing User Churn with Real-Time Prediction via Streaming ML Pipelines

Browse all the ML Case-Studies here.
Case-Study question
A major subscription-based platform wants to reduce user churn and improve engagement using a machine learning pipeline that processes streaming usage data in real time. They have user-level data points like watch history, subscription age, platform interactions, and demographic details. They aim to build a churn prediction model and then deploy targeted retention strategies for users at risk of leaving. How would you approach this project from data collection, feature engineering, model training, and deployment perspectives? Include how you would measure success through experimentation and outline the technical tools and infrastructure to handle large-scale data processing. Also discuss how you would monitor the model and handle model drift.
Proposed Solution
Data ingestion happens continuously from multiple sources. An ETL pipeline aggregates raw logs, merges them with user profiles, and transfers the data into a scalable storage system. Systems like Apache Kafka manage data streaming. Systems like Apache Spark or Flink perform distributed transformations.
Feature engineering focuses on aggregated engagement patterns. For example, watch_time_per_day, daily_active_minutes, last_subscription_change_date, number_of_ads_watched, or prior_cancellations. Each feature captures signals relevant to churn risk.
Model training starts with logistic regression or gradient boosting. Logistic regression is interpretable. Gradient boosting often achieves higher accuracy. For logistic regression, the prediction probability is:
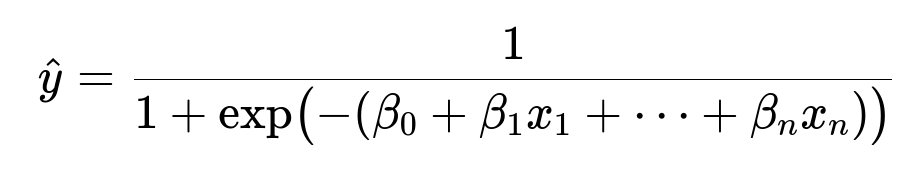
beta_0 is the intercept. beta_i are coefficients learned from training data. x_i are features. The logistic function produces a value between 0 and 1, indicating churn probability. Training data is split into development sets and validation sets. Hyperparameter tuning for the learning algorithm is done with a grid search or Bayesian optimization. Models are evaluated on AUC, recall, or F1. The final chosen model is tested in an A/B test where a subset of users identified as high-churn receive targeted retention offers. Engagement metrics are compared against a control group.
Real-time scoring uses a model deployment service. A microservice receives user data, applies the model, and outputs churn probability. That triggers retention workflows or personalized recommendations. Prediction outputs are logged for continuous retraining. Model drift is detected by tracking changes in data distributions. Retraining is scheduled if performance metrics degrade.
A/B testing or multi-armed bandit tests measure the impact on user churn rate. The platform monitors overall retention, average watch time, and subscription renewals. Production logs, error rates, and user feedback provide further metrics.
Experimentation ensures the pipeline’s success. The system gradually scales using infrastructure like Docker containers and Kubernetes. For heavy real-time loads, serverless components or specialized feature stores improve throughput. The model is monitored through a dashboard that tracks key metrics to detect any performance decline.
What if the data contains heavy class imbalance?
Class imbalance is common in churn predictions. Undersampling or oversampling are straightforward solutions, but synthetic data generation like SMOTE can be more effective for minority classes. Weighted loss functions let the model emphasize positive churn examples. Metrics like precision, recall, and F1 are more informative than raw accuracy when classes are imbalanced. For instance, if 5 percent churn, a naive model predicting “no churn” 100 percent of the time scores 95 percent accuracy but fails to identify real churners. The solution is to optimize recall or F1 to capture critical churn signals.
How would you handle seasonal changes in churn behavior?
Periodic shifts require dynamic retraining. The system might schedule monthly or quarterly model refreshes, or use a rolling window of training data. Feature engineering might incorporate seasonal signals, such as holiday periods that affect streaming habits. A feature that encodes the month of year, week of year, or holiday indicators helps the model adapt. When distributions shift unexpectedly, the monitoring system flags possible drift. Retraining corrects for new behaviors.
How would you ensure real-time predictions at scale?
A streaming service like Kafka captures user events. A real-time analytics engine like Spark Structured Streaming or Flink processes these events. A low-latency prediction microservice in a container environment receives feature vectors. Caching or embedding a lightweight model in memory yields millisecond response times. A distributed feature store serves features to the prediction service. Horizontal scaling via Kubernetes auto-scaling meets demand spikes.
Could you demonstrate a Python snippet that trains a logistic regression model?
import pandas as pd
from sklearn.linear_model import LogisticRegression
from sklearn.model_selection import train_test_split
from sklearn.metrics import roc_auc_score

# Example data loading
df = pd.read_csv('churn_data.csv')

# Example feature/label extraction
X = df[['watch_time_per_day', 'subscription_age', 'platform_interactions']]
y = df['churn_label']

# Train/validation split
X_train, X_val, y_train, y_val = train_test_split(X, y, test_size=0.2, random_state=42)

# Model instantiation
model = LogisticRegression(max_iter=1000)

# Fitting the model
model.fit(X_train, y_train)

# Prediction and metric
y_pred_prob = model.predict_proba(X_val)[:, 1]
auc_score = roc_auc_score(y_val, y_pred_prob)

print("AUC:", auc_score)
This code loads data with a label churn_label. It splits data into train and validation sets. It trains a LogisticRegression model, then evaluates AUC. Production code might automate hyperparameter tuning, incorporate more features, and log results to a database.
How would you scale beyond logistic regression?
Advanced models include tree-based ensembles (e.g., XGBoost, LightGBM, or random forests). These handle non-linear relationships and complex interactions. Neural networks learn deep patterns but often require large datasets and tuning. Large-scale data might require distributed training on Spark MLlib or Horovod. Clusters or cloud-based GPU resources accelerate training. Pipeline orchestration with tools like Airflow or Kubeflow ensures reproducibility.
How do you evaluate success?
Churn rate reduction is the primary measure. A/B tests compare targeted interventions to a control group. If the churn rate drops significantly for the treatment group, the solution is successful. Secondary measures like engagement or incremental revenue show broader impact. Tracking these metrics over time validates ongoing model performance. If metrics degrade, you investigate data shifts or errors in the pipeline. If the churn model is integrated with personalization systems, user satisfaction surveys or average watch time reveal synergy effects.
How do you handle incomplete or noisy data?
Incomplete data arises from partial logs or user privacy controls. Data imputation methods fill missing fields. A simple approach uses median or mean for numeric features, or a default category for categorical features. Advanced techniques train separate models to predict missing values. Noisy data from user logs is cleansed with outlier detection or data validation rules. If certain fields are consistently unreliable, they might be excluded. Online data checks might reject malformed records. Exploratory data analysis identifies anomalies or suspicious spikes that could signal data corruption.
How do you manage model drift in production?
Scheduled monitoring compares recent data distributions to the training baseline. Large shifts suggest drift. If the churn rate or feature patterns shift, the system triggers retraining. Shadow deployments let you test new models behind the scenes. If performance improves, you roll out the new version. Canary releases limit risk by exposing only a fraction of users to the updated model. Feedback loops track production performance metrics continuously.
How would you address privacy and compliance?
Sensitive user data requires anonymization. Data encryption is enforced in transit and at rest. Role-based access control ensures only authorized personnel can retrieve sensitive fields. Aggregating or hashing user IDs protects privacy in the training sets. Compliance demands data retention rules and explicit user consent. Data pipelines include data governance checks to ensure usage aligns with privacy regulations.
How do you see this scaling with billions of data points?
Distributed storage like HDFS or cloud-based object storage stores logs. Compute engines like Spark or Flink handle parallel data transformation. Feature stores manage millions of records with low-latency lookups. Container orchestration with Kubernetes scales the serving layer horizontally. Monitoring uses a centralized system that aggregates metrics from multiple regions. The pipeline design must handle concurrency, ensuring data consistency and real-time availability. Caching frequent lookups and using partitioned data architectures optimizes throughput. At extreme scale, solutions might need specialized big data frameworks and partitioning strategies to handle partition skew or large joins.