
ML Case-study Interview Question: Predicting Retail Revenue Using Normalized Mobile Foot Traffic Data

Case-Study question
A large U.S.-based retailer wants to estimate its physical store revenue. It only has public quarterly revenue data available, but it has purchased third-party daily foot traffic data for each store. The foot traffic data originates from a panel of mobile phone users whose location is tracked when they visit each store. The retailer wants to forecast quarterly in-store revenue to guide investment decisions. How would you use this foot traffic dataset to build a predictive model for the chain’s total in-store quarterly revenue?
Provide your step-by-step approach. Describe how you would handle limited historical data, possible biases in the mobile phone panel, and any modeling considerations. Include how you might use data from similar retailers, how you would normalize the foot traffic data for each location, and how you would address concerns such as overfitting or sample biases. Describe any challenges you foresee with this method of revenue estimation and how you would mitigate them.
Detailed Solution
A model can be built by aggregating daily foot traffic to match the quarterly revenue reporting. The simplest structure is to regress the retailer’s reported historical quarterly revenue on the quarterly sum of normalized foot traffic. Historical data is limited, so combining data from similar retailers or using simpler models with regularization can help reduce overfitting.
Data is non-normalized and drawn from a fluctuating mobile phone panel. A normalization strategy involves dividing the observed foot traffic by the sample’s panel size and then scaling it by the relevant population. For each store, the ratio of observed visits to the panel size can be multiplied by the real-world population for that geographical area.
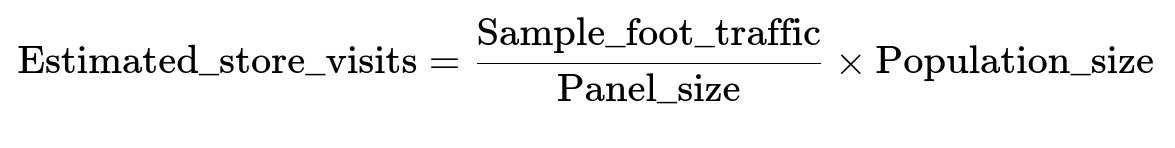
Sample_foot_traffic is the observed device counts for that store over a period. Panel_size is the number of devices in the region for that same period. Population_size is the actual population in that region. After aggregating these estimates for all stores, sum them for the quarter to represent a feature in the regression. Next, regress the retailer’s quarterly revenue on this aggregated foot traffic feature, applying a linear model or a regularized approach if overfitting is suspected.
Data may contain biases. Panel members might be younger or more tech-savvy than the general population. Checking bias involves comparing the panel’s home locations and demographic patterns with public census data. If a region is underrepresented, weight the data to better reflect true population distributions. Store visits may not translate to sales, but foot traffic is often correlated with purchases. Combine foot traffic with other signals like credit card data if available.
Third-party sources can change their methodology. That can disrupt model consistency if the underlying foot traffic data shifts. Monitoring the foot traffic over time and controlling for abrupt changes in distribution can mitigate this. Minimizing complexity and choosing robust methodologies (like linear regression with proper regularization) are useful to handle small sample sizes of quarterly revenue data (for instance, 12 quarters equals 12 data points). Including comparable retailers adds more training points, although differences in store formats must be accounted for.
Follow-Up Question 1
How would you address the risk of having just 12 quarters of data, leading to only 12 data points in your training set?
Answer and Explanation
Simple models. Linear regression or other low-variance approaches are more suitable. More complex models can lead to overfitting with so few data points. Combine data from similar retailers’ historical revenue and foot traffic to expand the dataset. Use domain knowledge to assume that foot traffic influences retail sales similarly across comparable big-box chains. Keep parameters to a minimum and apply regularization to ensure model stability. Report a broader confidence interval given the limited data.
Follow-Up Question 2
How would you handle the challenge of sampling bias when using a mobile phone panel?
Answer and Explanation
Check the panel’s distribution of home locations by mapping each device to a region. Compare with official population statistics at various levels of granularity. If certain geographies are underrepresented, adjust with weighting strategies. Consider demographic attributes (e.g., income proxy from census block groups) to see if the panel aligns with the broader population. If it does not align, weight the contribution of underrepresented segments more heavily or consider additional data sources that fill coverage gaps.
Follow-Up Question 3
What approach would you take if you found highly correlated features in your foot traffic dataset?
Answer and Explanation
Look at correlation matrices to find redundant features. Perfectly correlated features result in infinite or unstable regression coefficients. Remove or combine these correlated features. Dimensionality-reduction methods, such as Principal Component Analysis (PCA), can also eliminate multicollinearity. Simpler models with fewer explanatory variables reduce the risk of inflating the variance of coefficient estimates.
Follow-Up Question 4
How would you handle the possibility that some subsets of data produce very different regression coefficients for the same feature?
Answer and Explanation
This suggests heterogeneity in the underlying data. Segment or cluster the stores or time periods into more homogeneous groups. Either build separate models for each cluster or switch to a modeling approach that can automatically learn different behaviors, like tree-based models. Still examine whether the data collection process or sample coverage changed in those subsets, because it could be a sampling or data shift issue rather than just random variation.
Follow-Up Question 5
How would you address the limitation that foot traffic does not guarantee purchases?
Answer and Explanation
Foot traffic is only a proxy for sales. Transactions can be more accurately estimated using data from credit card providers or point-of-sale sources. If you have no transaction data, track correlation between historical foot traffic and actual revenue to see if it is reliable. If correlations are weak, combine foot traffic with other signals. If correlations are strong, ensure consistent data collection and monitor any major changes to the foot traffic provider’s methodology.