
ML Case-study Interview Question: Cross-Selling Platform Services Using Matrix Factorization Recommendation Systems

Browse all the ML Case-Studies here.
Case-Study question
A large platform offers multiple services (transport, food delivery, package delivery, digital payments) within one application. Many users only use a single service. Management wants to cross-sell other services to these one-service users to increase overall engagement. How would you design a machine learning solution to identify which users to target, and which service(s) to suggest to each targeted user?
Provide a detailed strategy, including data sources, feature engineering, modeling choices, and how you would evaluate the solution in a real-world setting. Also describe your plan to handle scalability and implement the final pipeline.
Detailed Solution
A first approach could be to frame this as a classification task. Classify users who have never tried a certain service into two classes: those likely to use it if promoted, and those unlikely to do so. That yields decent results but becomes difficult to scale because you must train a separate classifier per service, which is cumbersome.
A more scalable approach is to formulate this as a recommendation system problem. The goal is to match each user to the service(s) they have the highest propensity to use next. A common technique is matrix factorization, where you build a utility matrix of users vs. items. In this context, items can be any service or service-payment combination. You store the number of interactions (ride count, food order count, etc.) as values in the matrix.
You then factorize the utility matrix into two matrices that represent users and items in a latent dimension. Spark can handle large data. With a library such as Spark ML, you can train this model in a distributed environment, which reduces training time significantly.
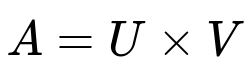
Where:
A is the large utility matrix with rows as users and columns as services.
U represents user embeddings in a latent factor space (rows = users, columns = latent factors).
V represents service embeddings in the same latent factor space (rows = services, columns = latent factors).
You fill missing entries in A by taking the dot product of the corresponding row in U with the column in V. A higher predicted value indicates stronger user-item affinity. That means you can rank each user’s top services, or each service’s most likely users.
Implicit feedback is typical. People rarely rate services explicitly. Instead, you rely on usage frequency as a proxy for preference. For optimization, Alternating Least Squares (ALS) is a good choice for implicit feedback in a distributed environment. You might also explore Stochastic Gradient Descent (SGD), but ALS is often simpler to run on large clusters.
You extract data from your data warehouse, transform it into the utility matrix, then feed it into your distributed training system. After model training, you retrieve top-N service predictions per user, or top-N users per service. You apply these lists to your marketing campaign pipeline for targeted cross-sell promotions.
A typical field test is to run a controlled experiment. Compare a group targeted by your model (test group) vs. a random group (control). If the conversion uplift in the test group significantly outperforms the control group, your system is likely working.
Below is a simple example of training a recommendation model with Spark ALS in Python:
from pyspark.ml.recommendation import ALS
from pyspark.sql import SparkSession

spark = SparkSession.builder.appName("CrossSell").getOrCreate()

data = spark.read.parquet("path/to/utility_matrix.parquet")
als = ALS(
    maxIter=10,
    regParam=0.1,
    userCol="user_id",
    itemCol="service_id",
    ratingCol="interaction_score",
    implicitPrefs=True
)
model = als.fit(data)
recommendations = model.recommendForAllUsers(numItems=5)
You then convert the recommendations output into a final table of (user, top services, predicted scores). This table is used to drive the marketing campaign.
What if cold-start users have no interactions yet?
Cold-start users do not appear in your utility matrix. You might create a rule-based fallback or a demographic-based heuristic. You might also train a separate classification model for that segment, or rely on known user attributes like location or known consumption patterns from similar profiles.
How do you compute the interaction score when using implicit data?
You can use frequency of usage as a simple integer score. Another approach is to transform usage frequency into a scaled score that emphasizes repeated usage. For instance, log transform usage count to avoid large outliers. You might set a floor or cap to avoid extreme values.
How would you ensure the model remains effective over time?
You can retrain regularly to capture trends in user behavior, such as seasonal changes or newly launched services. You can implement incremental training if the platform supports it. You also monitor model performance metrics like AUC or Precision@k on validation data. If performance degrades, you investigate drifting data distributions or new usage patterns.
How can you differentiate between occasional purchases and genuine user preference?
You can weight recent purchases more. You can define a window (for instance, last 3 months) so that fresh data gets more importance. A time-weighted approach ensures the system captures evolving preferences. You might also define churn thresholds to filter out long-inactive users.
How would you handle different marketing goals or constraints?
Sometimes you only have a budget for a limited set of users. You can rank them by predicted probability of cross-sell and select the top portion under budget constraints. You can also incorporate cost factors or expected revenue to optimize the final campaign list. You might run multiple campaigns concurrently, so you can also A/B test different approaches.
How do you measure success beyond conversion?
You can measure metrics such as retention of cross-sold users, long-term frequency of usage of the newly adopted service, or total spend over a period. You check how many cross-sold users remain active. You also watch if spamming attempts lead to unsubscribes or poor user experience.
What if the system incorrectly recommends obviously unrelated services?
You can incorporate negative feedback signals. If a user never responds to certain offers, you can penalize those items’ predicted affinity. You can also add business rules. If a user is physically located in an area where certain services are unavailable, you exclude those services.
Could you try a hybrid system?
Yes. You can combine matrix factorization with content-based filtering (using user demographics or item attributes) to produce hybrid recommendations. You might also add wide and deep models or graph-based approaches for more nuanced relationships. You compare these in experiments and keep the best.
Why not just rely on simple user segmentation?
Segmentation helps in broad strokes but might miss nuanced user-level preferences. It cannot capture the complex relationships each user might have with multiple services. A matrix factorization approach is more precise.
How would you address data imbalance?
You can oversample or undersample certain usage patterns if needed. You might treat repeated usage in the rating column carefully. You can tune hyperparameters of ALS or SGD to handle high or low usage extremes. You can also incorporate weighting to control for skew.
Why did you choose matrix factorization instead of user-user or item-item nearest neighbors?
User-user neighbors require storing a matrix of size n^2 in memory, which is large for millions of users. Item-item neighbors assume similarities among items, which is harder to define across different services. Matrix factorization only needs factor matrices that are far smaller than the full utility matrix.
Could you use deep learning?
You might embed user and item features in neural networks. This is more complex and needs more data engineering. You would feed user history, user demographics, item features, and so on. You compare performance and compute costs. If deep learning yields a large gain, you might adopt it.
How do you maintain real-time updates?
You can capture streaming updates in near-real-time, keep a running window of user-service interactions, and periodically retrain. Full real-time factorization can be expensive. A micro-batch approach every few hours or once a day is often enough for cross-sell campaigns.
How do you handle privacy or data compliance?
You anonymize user identifiers. You only store aggregated interactions in your utility matrix. You comply with data regulations by respecting user consent. Sensitive attributes remain excluded unless explicitly needed and permitted.
Could you simply do logistic regression with many user features?
Yes, that is valid for a single product. But for many products, you would need repeated training. Matrix factorization offers a unified solution. If logistic regression outperforms factorization for a single product, you might blend it with your recommendation engine outputs for a final solution.
How do you deploy the final model?
You store the user latent vectors and item latent vectors in a fast-lookup environment. When you want to find top items for a user, you perform the dot product of that user vector with each item vector. Or you cache the precomputed top recommendations in an in-memory store. The marketing pipeline can query that store to generate promotional campaigns.
If management wants quick results?
You might start with a classification approach to show initial benefits. Then transition to a scalable recommendation system. The quick method sets a baseline. Over time, you measure the gains from the matrix factorization pipeline.
How do you handle multiple objectives?
You might add constraints to your recommendation ranking. You could weigh each service’s margin or factor in user satisfaction. This means your final rank is a combination of user-service propensity and business objective. Multi-objective optimization might be needed if you have conflicting goals.
How do you confirm your approach is correct?
You run offline validation. You compare predicted usage vs. actual usage. Then you do an A/B test or multi-armed bandit approach in production. You track conversion uplift, user satisfaction, and retention. If metrics improve, you keep iterating and refining the model. If they stall, you investigate data, features, or the algorithm setup.
How do you handle ephemeral anomalies in data?
You can define thresholds or rolling windows to smooth out spikes. If an unexpected external event causes abnormal usage, you can reduce its weight. You watch logs and model performance. If anomalies appear, you do a partial retrain or override. Over time, you incorporate robust data checks to guard your pipeline.
How would you design each pipeline stage?
You extract usage data, build the user-service matrix, train a factorization model with Spark, generate top recommendations, store them in a data store, and feed them into your marketing or user interface layer. You automate the entire pipeline on a daily or weekly schedule. You maintain logs for each step.
How do you see this approach extending to advanced hyper-personalization?
You could integrate personal context signals like location, time of day, or even large language models for user queries. Factorization remains the core for item matching, but these additional signals can help reorder or refine final recommendations for each user in real time.