
ML Case-study Interview Question: Scalable Nationwide Home Valuation via Neural Networks and Quantile Regression.


Browse all the ML Case-Studies here.
Case-Study question
A large real estate aggregator uses a home-valuation tool that estimates the market value of properties across the country. It covers more than 100 million off-market homes. They created a new deep learning system called the “Neural Home Estimator,” which integrates local and national market dynamics, historical transactions, taxes, and property details into a single nationwide model. They phased out multiple regional models in favor of one national neural model. This change helped them handle local idiosyncrasies through fine-grained location features and learn temporal effects via continuous and cyclical representations. They also used quantile regression to capture the uncertainty and produce valuation ranges. Evaluate this scenario and propose a plan to build and maintain such a system for accurate home valuation at scale. Discuss data gathering, feature engineering for geographic and temporal information, model architecture, uncertainty estimation, validation methods, and production deployment strategies.
Detailed solution
Data Gathering and Feature Integration
Collect multiple years of property records, including sale transactions, tax assessments, geography, and home characteristics such as bedrooms, bathrooms, property type, and square footage. Incorporate fine-grained location data by dividing maps into small grid cells, treating each cell as a categorical feature. Add multi-scale cells at different resolutions. Combine standard region identifiers with these grid cells so the model learns local details as well as regional and national patterns.
Include time-based features in continuous form. Represent long-term upward or downward trends using a single numeric that covers the entire timespan of the training data. Capture seasonality with cyclical transformations that make the end of the year close to the start of the following year.
Neural Network Architecture
Train a single neural model that learns everything end to end. Replace the old pipeline of region-specific models with a network that integrates location, time, and home attributes in one process. Teach it to predict sale prices from the joined feature space. Let it discover high-dimensional interactions (for example, location embeddings) that are cumbersome for traditional models.
Keep the architecture flexible. Different layers can handle numeric variables, while embedding layers handle categorical inputs like property types, grid cells, or transaction year. Output a point estimate or multiple quantiles.
Uncertainty Estimation
Use quantile regression to generate a range of potential home values. This captures the inherent noise in real estate transactions caused by local supply-demand, buyer sentiment, and seller motivation. The model produces a lower bound, median, and upper bound estimate. If the spread is too large, treat it as a signal that the estimate has high uncertainty.
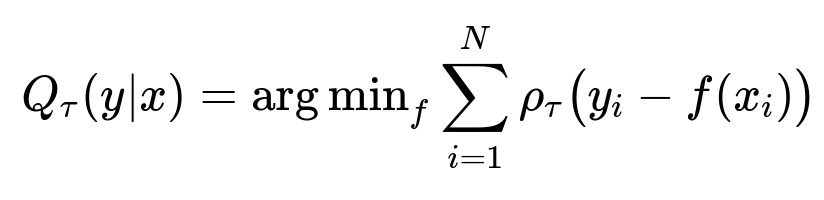
Here Q_{tau}(y|x) is the tau-th quantile of y given features x. y_i is the true sale price. f(x_i) is the predicted quantile. rho_tau is the pinball loss that penalizes over- and under-estimates differently based on tau.
Validation and Backtesting
Split historical data so older sales train the model, while newer sales measure performance. This simulates future sales. Compare predictions with actual final sale prices. Track median absolute error, mean absolute error, or median percentage error. Confirm the model has minimal bias and the distribution of errors is stable across time and regions.
Use backtesting after each model iteration, measuring accuracy on millions of real transactions. Confirm improvements in local markets and the overall national scale.
Production Deployment
Deploy a single model for the entire country. Centralize the training and inference pipelines, reducing infrastructure complexity. Update the model regularly, feeding it newly available data and adjusting to market changes faster.
Simplify updates to the code that extracts new features (such as high-quality listing photos and text descriptions). Integrate these features, retrain the model, and roll out with continuous integration processes.
Maintain logs of input data and inference outputs so that the system can be monitored for anomalies. If certain areas show systematically larger error, refine that section of the data or the model architecture.
Example Implementation Snippet (Python)
import torch
import torch.nn as nn
import numpy as np

class NeuralHomeEstimator(nn.Module):
    def __init__(self, num_numerical, cat_embedding_dims):
        super().__init__()
        # Example embedding layer for location tiles (cat_embedding_dims might be a list)
        self.embeddings = nn.ModuleList(
            [nn.Embedding(cat_dim, emb_dim) for cat_dim, emb_dim in cat_embedding_dims]
        )
        # Simple feedforward
        self.hidden = nn.Sequential(
            nn.Linear(num_numerical + sum(e.embedding_dim for e in self.embeddings), 128),
            nn.ReLU(),
            nn.Linear(128, 64),
            nn.ReLU(),
            nn.Linear(64, 3)  # Lower quantile, median, upper quantile
        )

    def forward(self, x_num, x_cat):
        emb_outs = []
        for i, emb in enumerate(self.embeddings):
            emb_outs.append(emb(x_cat[:, i]))
        emb_conc = torch.cat(emb_outs, dim=1)
        x = torch.cat([x_num, emb_conc], dim=1)
        return self.hidden(x)

# Model training and pinball loss can be implemented for each quantile
Train on your entire dataset, capturing local, temporal, and property-level details in a single model.
What if questions and comprehensive answers
How do you handle the high-cardinality location feature?
Local real estate markets vary block by block. Grid tiling addresses this by representing small squares as categorical codes. The model learns embedding vectors for each small grid cell, letting it differentiate subtle neighborhood changes. This approach reduces the complexity of thousands of distinct city or zip labels.
Why not just use simple region-based appreciation and a separate model for sale price?
Maintaining separate models for every region is cumbersome, and combining them later can introduce errors. A single neural approach jointly learns appreciation trends and features that drive local values. This end-to-end method often outperforms pipelines with individually trained components.
How do you measure success when properties do not sell often?
Backtesting is key. Train on known sales from an earlier window, and test on unseen sales from a recent window. Continue to evaluate new sales. Summarize performance with error metrics (for example, median percentage error). A model that remains stable across time and regions is considered successful.
How do you incorporate uncertain variables like buyer urgency?
Quantile regression captures the range of possible outcomes. Urgency or buyer sentiment may not be fully represented by the main data. The model still provides upper and lower estimates around the most likely price. Extreme urgency might push the sale price outside that range, but the model’s best estimate often remains robust.
What if new data sources become available, such as 3D tours or advanced tax data?
Add these signals into the input pipeline. Expand the neural network to process images or textual descriptions in parallel to structured data. Use a multi-modal architecture. Experiment with different data transformations. Retrain the entire network so it learns to interpret these new features.
How do you keep this system accurate if the market changes abruptly?
Maintain continuous or frequent training. Add new sales and listing data as soon as they are available. Incorporate short-latency pipelines that retrain or fine-tune the model on fresh data. Keep cyclical and continuous time features updated.
What prevents large-scale biases in your predictions?
Monitor residuals across different neighborhoods and property types. Identify if the model systematically over or under estimates in certain regions. Investigate data drift or coverage gaps in training. Adjust model architecture or features and retrain.
How do you handle large compute costs with so many properties nationwide?
A single model shared across the country is cheaper than many local models. Use distributed training hardware and accelerate inference with parallel processing. Cache results for repeated queries. Only update predictions as often as necessary.
How do you validate that the new model truly outperforms the old approach?
Compare the new neural model’s predictions against final sale prices on a hold-out test set that was not used in training. Evaluate error metrics and distribution. Track whether the neural approach reduces median error, is less biased, and is more stable over time. Real-world transactions confirm these results.
How do you integrate multi-scale tiling in practice?
For each property, assign it a series of grid IDs at different resolutions. For instance, a low-resolution tile covers many zip codes, and a high-resolution tile covers a small cluster of streets. Treat each grid ID as a categorical feature. Feed them to embedding layers in the network. This approach helps the model learn broad region interactions and very local ones in parallel.
Could you confirm why you chose cyclical encoding for time?
Time-based one-hot encoding discards continuity. December 31 and January 1 are adjacent days. Cyclical encoding transforms time into angles on a circle (for example, sin and cos of the day or month). The network learns that month 12 transitions smoothly to month 1, preserving seasonality patterns.
How do you evaluate the final prediction’s correctness for intangible factors like property finishes or design?
More data about interiors and design helps. The next step is to parse listing descriptions and images so the network sees expensive kitchen updates or modern finishes. Without these features, intangible factors remain partly unmodeled, which is why quantile ranges are useful.
How do you continuously maintain and improve the model after deployment?
Track production metrics and user feedback. Watch if certain markets see large errors. Investigate data quality problems. Retrain with new data. Add or refine features. Deploy improved models through an automated pipeline. Re-run backtests to confirm better performance.
End of discussion.