
ML Case-study Interview Question: Scaling Real-Time Explore Recommendations using Embedding Retrieval and Neural Ranking

Case-Study question
A large social media platform wants to personalize the “Explore” section for hundreds of millions of daily active users. The Explore surface shows photos and videos from accounts that users do not yet follow, but might find interesting. The system must generate relevant recommendations in real time while handling massive volumes of incoming data and millions of concurrent requests. Propose a detailed approach for the recommendation system, focusing on candidate retrieval and ranking. Consider how to measure effectiveness with business metrics, how to address potential negative user reactions to highly accurate predictions, how to assess model drift, and what deployment strategies to use for safe rollouts. Include any relevant considerations for model training, inference speed, online vs. batch processing, and feature engineering.
Detailed Solution
Candidate Retrieval Approach
Using an account-based strategy reduces the enormous pool of content. Generating a vector-like embedding for each account helps find similarity between accounts. Representing a user’s interactions as a sequence of account visits is analogous to how word2vec represents words in sentences. Factorizing a large user-account interaction matrix can yield latent factors that map accounts into a shared space. KNN can then retrieve accounts similar to those a user has shown interest in.
Ranking Model
Ranking benefits from predicting multiple user actions. Assigning a probability to each potential action (like, comment, share, hide, report) treats the ranking step as a multi-class classification. Weighting these outcome probabilities based on business goals (such as engagement) produces a final ranking score. Training a neural network to handle these multi-action predictions scales well for large data volumes.
Addressing Model Drift
Monitoring model performance over time is crucial. Comparing feature distributions from current data to distributions from the training set indicates drift. KL divergence helps quantify changes in these distributions.
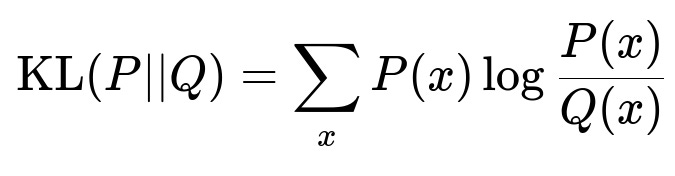
P(x) is the probability of data instance x in the new distribution, Q(x) is the probability of x in the original training distribution. A higher KL divergence signals that retraining the model may be necessary. Periodic retraining is often simpler operationally.
Why Model Improvements Might Not Correlate with Business Metrics
Over-optimizing certain metrics can cause saturation. Improvements in the ranking metric might not translate to higher engagement if the user experience feels overly tailored or intrusive. Extreme personalization can result in user discomfort or suspicion, impacting longer-term retention. A model that is too precise might reduce diverse discovery or prompt privacy concerns.
Deployment Strategy
A flighting approach is safer than a single large rollout. Running online A/B tests on a subset of users compares the new model’s performance to the old model, capturing both relevance metrics and real user behaviors (likes, comments, session times).
Online vs. Batch Inference
Serving recommendations in real time requires storing precomputed features in a fast-access system such as Cassandra. Batch processing in HDFS is too slow for live requests. In an online setup, embeddings, interaction histories, and user-level features must be instantly retrievable. This ensures that the candidate retrieval and ranking model can run at low latency and high throughput.
Follow-up Question 1
How would you handle a situation where your new model shows promising offline metrics but does not improve the key online engagement metric in A/B tests?
A thorough analysis starts with verifying that the model’s objective aligns with the engagement metric. Conflicts between surrogate metrics (like click-through rate) and final metrics (like time spent) can cause mismatches. If the model overfits to offline data distributions, real-world user behavior might differ. Investigating user feedback is critical if highly personalized recommendations cause discomfort. Checking data pipelines for errors or differences in feature generation between training and inference can be helpful. Confirming that the test setup has sufficient power and that confounding factors (holidays, new product features) are controlled is also vital. Sometimes, the baseline model might already saturate performance, requiring a more diverse approach or additional user-level features.
Follow-up Question 2
How would you ensure that the ranking model’s latency remains acceptable when user volumes spike?
Profiling and optimizing the inference path is essential. Offloading heavy feature transformations to offline workflows can reduce overhead at serving time. Caching frequent embeddings, compressing large model parameters, or distilling large models into smaller versions helps reduce inference time. Horizontal scaling with load balancers and ensuring model inference services have appropriate replication and autoscaling settings prevents bottlenecks. Monitoring end-to-end latency at each system step highlights where optimizations or architectural changes are needed.
Follow-up Question 3
What if certain user segments have less historical data or are new to the platform?
Cold-start users need fallback strategies. Using global popularity signals or popular accounts within a relevant category can bootstrap recommendations. Light personalization from limited signals like device type, user’s language settings, or broad location data can help. Gradually incorporating new behavior data updates the user’s embedding. Weights can be adjusted to give more influence to fresh interaction data while the model accumulates enough user-specific interactions.
Follow-up Question 4
How would you decide the weighting of different user actions (like, comment, share, hide, report) for the final recommendation score?
Conducting statistical analyses correlates each action type with top-level Key Performance Indicators. For instance, comments might be more valuable than likes if they correlate more with user engagement. Similarly, shares might be critical for network growth. Once the correlation is established, each action’s probability can be multiplied by a learned or hand-tuned weight. The combined result forms a unified score that reflects business priorities.
Follow-up Question 5
How do you plan for new features that might not have historical data for training the ranking model?
Gradual rollout of new features can involve partial usage to collect initial data. Combining unsupervised or self-supervised approaches can learn representations without labeled data. Once enough interactions accumulate, retraining the main ranking model to incorporate the new feature distribution becomes possible. Monitoring shifts in distribution helps confirm that the new features do not harm existing performance and that they add predictive signal.