
ML Case-study Interview Question: ML-Predicted Expected Revenue (XR) for Faster Subscription Platform A/B Testing

Browse all the ML Case-Studies here.
Case-Study question
A subscription-based technology platform wants to optimize its A/B experiments for onboarding new trial users. Traditional metrics (file uploads or short-term trial conversions) are either too narrow or take too long to observe. They build a machine learning-based metric, labeled “XR,” to represent a user’s expected revenue for the next two years. They use this XR metric to evaluate experimental cohorts a few days into the trial, instead of waiting months to see actual conversion and retention behaviors.
They store user events and trial metrics in a large data lake. They train gradient boosted trees to estimate each user’s Probability(Spend), then multiply that by a predicted two-year lifetime value to get XR. They calibrate XR by comparing it to actual revenue from past cohorts. They feed new user data into this model daily, and they orchestrate computations using a cloud-based pipeline. They calculate an XR lift ratio for each test variant and compare it to baseline, incorporating an uncertainty threshold (~3%) to decide if the variant’s revenue impact is conclusive or neutral.
They want to know how you would solve this case. How would you design, implement, and validate such a machine learning workflow for rapid A/B experiment decisions?
Detailed solution
Overview
This use case revolves around a subscription-based product wanting faster insights on user satisfaction and long-term revenue potential. They tackle this by introducing Expected Revenue (XR) as a machine learning metric. XR predicts the total subscription revenue from a user over two years, allowing experimenters to draw meaningful conclusions within days.
Core formula

Parameters:
Probability(Spend) is the probability that a user converts to a paid subscription and remains active.
Predicted_Amount is the anticipated sum of payments over two years, factoring in plan changes and churn.
They compute XR a few days into each trial, which is fast enough to iterate on experiments. XR is strongly correlated with actual revenue, so it aligns with long-term user satisfaction.
Modeling details
They collect training data from past users, including trial behaviors (e.g. daily activity, plan selection, region). They train gradient boosted trees to estimate:
Probability of subscription.
Likely revenue over two years, accounting for monthly vs. annual plans, plan upgrades, and churn events.
They build separate models for different user segments (e.g. business vs. individual). They use a framework like TensorFlow to develop the tree-based models, and the training and inference pipeline runs on a cluster orchestrated by Airflow. The data resides in Hive tables on top of Hadoop, and the final models are stored on Amazon S3.
Calibration
They compare model predictions to actual revenue observed in historical data to estimate an offset correction by trial day, plan type, and region. They apply this offset so that XR tracks real revenue closely. This reduces systematic bias.
Architecture
They run daily jobs via Airflow to:
Gather new trial user signals from the data lake (Hive).
Retrieve the stored gradient boosted tree models from S3.
Compute XR for every user, adjusting with the calibration offset.
Append XR results to a table accessible to analysts.
They use Spark to process all new trials and store the final XR values back into the data lake.
Using XR in A/B experiments
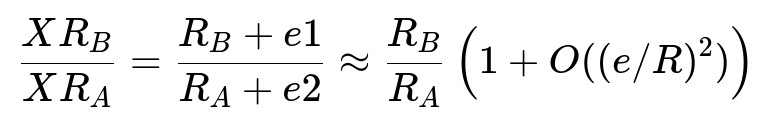
They sum XR across the entire cohort in each test variant and compare it to the baseline. That comparison yields an XR lift ratio:
Parameters:
XR_B and XR_A are the XR sums for the test (B) and control (A) groups.
R_B and R_A are the actual total revenues of the two groups (not directly used for new experiments, but known for concluded ones).
e1, e2, and e represent the approximate differences between actual revenue and predicted XR. The offset corrections keep e small.
If the XR lift is below a 3% threshold from unity, they consider the impact revenue-neutral. If it exceeds 3%, they conclude the effect is significant. This approach lets them avoid waiting months for actual subscription revenue to materialize.
Example code snippet (training with Spark MLlib)
from pyspark.ml import Pipeline
from pyspark.ml.feature import VectorAssembler
from pyspark.ml.regression import GBTRegressor
from pyspark.sql import SparkSession

spark = SparkSession.builder.appName("XRModelTraining").getOrCreate()

data = spark.read.format("parquet").load("s3://bucket/training_data")
# Basic feature engineering example
assembler = VectorAssembler(
    inputCols=["feature1", "feature2", "feature3"],
    outputCol="features"
)

gbt = GBTRegressor(featuresCol="features", labelCol="label", maxIter=100)
pipeline = Pipeline(stages=[assembler, gbt])
model = pipeline.fit(data)
model.write().overwrite().save("s3://bucket/models/xr_gbt_model")
This snippet illustrates a gradient boosted tree regressor that can predict lifetime revenue or probability of subscription. In production, there might be two models (one for probability, one for amount).
Practical benefits
XR helps them:
Evaluate an experiment’s revenue impact in days.
Prioritize user satisfaction, because paying users tend to be satisfied.
Integrate dimension changes (monthly vs. annual, plan switching) into the metric.
Follow-up question 1 (Model generalization)
Question: How do you ensure the XR model does not overfit to historical patterns that might shift over time?
Answer: They implement regular validation pipelines on recent cohorts, plus systematic recalibration. They track any growing variance between XR and actual revenue over multiple weeks. If that gap rises, they retrain with updated data. They also incorporate region and plan segmentation so that temporal changes in one region do not create broad distortions. They use cross-validation on multiple time windows to confirm stable performance. They monitor calibration metrics weekly to catch drift early.
Follow-up question 2 (Handling systematic uncertainty)
Question: What strategies can reduce bias if the model systematically underpredicts or overpredicts certain user segments?
Answer: They apply calibration offsets tailored to plan type, trial day, and location. They evaluate average residuals (actual minus predicted) in these segments. They then add an offset for each segment. If the model underpredicts business trial users in North America, they add a positive offset for that segment. They frequently back-test these offsets against fresh data to verify improved alignment.
Follow-up question 3 (Scaling and orchestration)
Question: The platform expects a large influx of new trials. How do you manage high-volume batch computations daily?
Answer: They use Airflow to schedule tasks. Each task:
Fetches the day’s new trials from Hive.
Loads the latest model from S3.
Runs a Spark job to compute XR. They provision sufficient cluster resources to handle the data volume. They parallelize the process through Spark’s distributed data frame operations, and they write the outputs back to Hive for analytics. Auto-scaling on AWS ensures they provision more compute during large spikes.
Follow-up question 4 (Interpreting results in real-world experiments)
Question: If an experiment shows a 2% XR lift but is within the 3% systematic uncertainty, can any conclusions be drawn?
Answer: A 2% difference is not statistically or systematically above the threshold. They mark the experiment as revenue-neutral and then examine secondary metrics, like user engagement or product usage patterns, to see if there is any meaningful change. They might still proceed if qualitative evidence or other metrics hint at improvements.
Follow-up question 5 (Model updates and retraining)
Question: How often should this model be retrained?
Answer: They retrain at intervals aligned with shifts in user behavior, product offerings, or pricing. Monthly or quarterly retraining is typical, but they also watch for major product launches or marketing changes. If XR residuals spike, they trigger an earlier retraining. They maintain multiple model versions and run offline comparisons to confirm improvements before deploying updates.
Follow-up question 6 (Potential business trade-offs)
Question: If XR metrics prioritize short-term conversion probabilities, do you risk ignoring longer-term engagement factors?
Answer: They incorporate retention, churn, plan switching, and upsells into the predicted two-year revenue. This approach captures longer-term effects, since the final XR includes how likely users are to remain subscribed or upgrade. If short-term behaviors misalign with actual long-term satisfaction, the calibration step and historical data reflect that mismatch. This keeps the model focused on sustained revenue instead of quick conversions alone.