
ML Case-study Interview Question: Optimizing Ride-Sharing Metrics Using Causal DAGs and Experiments

Browse all the ML Case-Studies here.
Case-Study question
You are given a ride-sharing platform whose Data Science teams manage several levers such as driver bonuses, rider coupons, pricing strategies, and driver activation campaigns. Each team wants to optimize its own metric (for example, increasing number of rides or revenue, or managing budget). Confounding effects from past decisions complicate accurate forecasting, and simple correlational models lead to flawed outcomes. Construct a causal forecasting approach that can reliably model how each lever affects key performance metrics. Specify what steps and methodology you would use to (1) build a causal model of the marketplace, (2) integrate experiments to estimate how changes in policy variables shift outcomes, and (3) optimize these policy variables to achieve organizational goals (for example, maximizing rides subject to a revenue-per-ride constraint). Propose your solution strategy, outline any technical trade-offs, and explain how you would handle large-scale implementation and integration across multiple product teams.
Detailed solution
Causal forecasting can address confounding in historical data by explicitly modeling the directional relationships between variables. Represent each variable as a node in a directed acyclic graph (DAG). Construct smaller models for each node, then stitch them together into one large system. For instance, show how driver incentives lead to changes in driver hours, how rider coupon usage can affect rider conversion, and how these variables propagate to core outcomes like total rides and revenue.
Use experiments to anchor how each policy variable affects its downstream metrics. For driver incentives, use an experimentally determined cost curve mapping driver bonus spending to total driver hours online. Ensure the final node-level models incorporate that curve when predicting hours for different bonus levels. Avoid purely correlational fits by reinforcing any local submodel with the experiment-derived relationship. This preserves predictive power while ensuring the model is valid when planning new policy values.
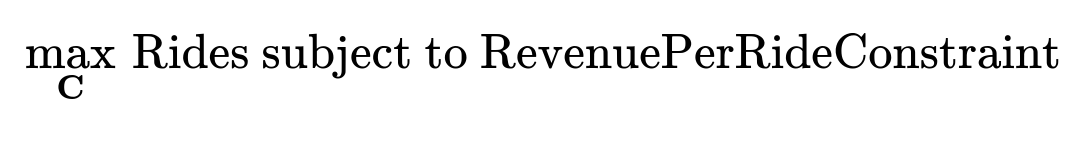
Combine submodels into a larger DAG and feed in each policy variable as a node. Let the model predict each key metric of interest (rides, revenue, etc.). This allows scenario simulation. Generate forward-looking plans by specifying driver incentive budgets, coupon budgets, or pricing parameters, then run them through the DAG to see the resulting forecasts. Integrate an optimizer to explore the high-dimensional policy space. For example, to maximize total rides subject to a target revenue-per-ride, define a constrained objective and use a suitable optimizer (for instance, a gradient-based method if the model is differentiable, or a more general approach if not).
Below is an example of a central formula for objective optimization in big font:
Here, C represents the vector of policy variables. The DAG-based model m(.) estimates total rides and revenue based on C:
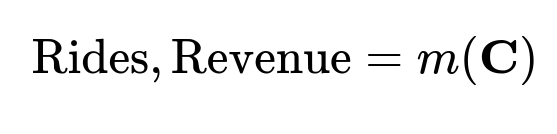
The chosen optimizer searches the space of C to find a plan that meets the target trade-off between rides and revenue per ride. Use frameworks that support automatic differentiation (for example, PyTorch) to handle the partial derivatives of each submodel with respect to policy variables. This helps scale up the solution and unify submodels contributed by different teams, while respecting their experimental relationships.
Implementation involves building a modular pipeline that loads each submodel, composes them into the DAG, and provides an optimization layer. Store each submodel in a standardized interface so it can be updated independently when new experiments or data become available. This approach encourages parallel development, fosters consensus among product teams, and ensures consistent causal logic across the entire platform.
What are some potential follow-up questions?
How do you ensure submodels remain consistent when multiple teams independently update their portions?
Each team’s submodel defines how a policy variable or upstream metric drives the team’s primary metrics. Version control all submodels in a shared repository. Implement integration tests that verify predictions do not deviate from agreed-upon baselines unless an intentional update is made. Before merging any changes, run a full DAG regression check to confirm no unexpected negative interactions occur. Maintain an internal governance process where each update is documented with justifications, data sources, and experimental evidence.
How do you reconcile conflicts if experimental evidence and historical data contradict each other?
Use a hierarchical modeling approach that fits historical data while imposing a strong prior from the experiment-based relationships. If the historical data suggests contradictory inferences, investigate whether it arises from confounding, drift, or sampling bias. If the experimental design is sound, weight that evidence higher because randomization reduces confounding. If conflicts persist, run additional experiments or analyze smaller segments of historical data where confounding might be less severe.
How would you handle variables that might feed back into each other, creating potential loops?
Model time-lagged effects or break loops by focusing on immediate causal flows. If there is a true feedback cycle, split it over time steps. For example, driver incentives in one week may affect next week’s driver hours, which then affect supply metrics, which influence the next incentive policy. Represent these steps in a time-expanded DAG. If there is an irreducible cycle within a single time step, approximate it with iterative fixed-point solvers or a structural equation approach. Ensure the end user understands the assumptions of these iterative solutions.
How do you approach high-dimensional optimization for complex policy spaces?
If the entire model is differentiable, use gradient-based optimizers like Adam or LBFGS to explore the space. Regularize strongly to avoid overfitting local minima. For discrete policy variables or non-differentiable pieces, use gradient-free methods such as evolutionary algorithms or Bayesian optimization. Hybridize both if some variables are continuous and others discrete. Maintain caching of submodel computations to speed up repeated evaluations.
What if new levers or policy variables are introduced?
Extend the DAG with new nodes and edges reflecting the relationships of the new lever to existing metrics. Gather experimental or quasi-experimental data to estimate the new causal link. Retrain or adjust relevant submodels. Continue to store these updated submodels in the common repository so the system stays current and cohesive.
How do you test the accuracy of your causal forecasts before deployment?
Partition historical data into training and test sets chronologically. Train the submodels (with experiment-informed constraints) on the training portion. Evaluate predictions on the test period by simulating known policy decisions from that timeframe. Compare predicted values with observed outcomes. Additionally, hold out certain experimental results to confirm the model can replicate them. Track metrics such as mean absolute error, mean absolute percentage error, and evaluate alignment with the cost curves from real experiments.
Would you rely solely on PyTorch for large-scale data engineering?
PyTorch is ideal for flexible model building, autodifferentiation, and iterative optimization. Use a separate data pipeline (for example, Spark or SQL-based data warehouses) for feature engineering, data transformations, and monitoring. Store final preprocessed data in an accessible format so that PyTorch ingest is fast. Parallelize or distribute training to handle large volumes.
How do you update these models in real time if market conditions change frequently?
Set up a rolling update schedule, such as weekly or daily. Incorporate new data as it arrives and retrain submodels with the latest signals. If the system must adapt faster, consider an online training loop that refits lighter-weight layers or parameters whenever new data arrives. Keep a fallback model to handle abrupt regime shifts. Monitor key metrics continuously and compare them to the model’s predictions to detect drift.
How do you measure success in production?
Compare forecasted metrics with actual outcomes regularly. Track whether the chosen policy truly led to the expected changes in rides, driver hours, or revenue. Run holdout experiments to ensure the forecasts remain reliable. Evaluate net gains, such as total rides gained per dollar spent, or driver hours gained per dollar in incentives. If results deviate, re-examine assumptions, confounding factors, or model drift and adjust accordingly.
How do you ensure reliability for high-stakes decisions?
Use strong validation procedures, run A/B tests whenever possible, and incorporate robust error bars or prediction intervals around forecasted metrics. Stress-test the optimization with scenario analyses and sensitivity tests. If critical thresholds are at stake (for example, a minimum expected revenue), enforce constraints on forecast intervals, not just point estimates.
How would you handle manual overrides or executive choices outside the model recommendations?
Allow a “manual policy override” interface. Capture that override in your system so it remains traceable and measurable. Log the difference between the system’s recommendation and the final chosen policy. Provide feedback loops to highlight any discrepancies in subsequent model retraining. Use these cases to refine or challenge your assumptions.
How do you integrate changes from new experiments into the shared DAG?
When a team completes a new experiment (for example, a fresh cost curve for driver bonuses), incorporate the updated functional relationship into that submodel. Rerun integration checks. If the new relationship conflicts with the old one significantly, treat it as a new version. Deprecate the old relationship after thorough testing. Tag all changes in version control. Communicate them so that high-level forecasting aligns with the latest evidence-based updates.
How do you handle data privacy and compliance?
Follow a layered approach with data anonymization, encryption, and secure pipelines. Only share aggregated metrics between teams. If the model requires individual-level data (for example, user-level coupon redemption), store such data in secure, access-controlled environments. Generate only aggregated or de-identified outputs for final modeling. Ensure that all experimental data also follows compliance policies before use in the DAG.
How would you scale this method for a global business with multiple markets?
Partition models by region if local dynamics differ substantially. Let each region’s model share certain components (such as driver incentive cost curves) if they are globally consistent. Localize them when needed (for example, pricing elasticity may vary by city). Provide a standardized framework so each market can incorporate unique experiments while retaining the central DAG approach.
How do you maintain model interpretability?
Keep each submodel’s functional form clear and traceable to the relevant experiments. Provide visual DAG tools for stakeholders to see how each variable influences downstream nodes. Offer model-agnostic explanations (for example, partial dependence or shapley-based methods) on final predictions. Document any submodel parameters, including cost curve shapes or transformation steps, so non-technical decision makers can follow the causal chain.
How do you troubleshoot a mismatch between predicted and actual outcomes?
Break down the DAG and compare intermediate forecasts. Verify each submodel’s output aligns with real data. Check that external factors not in the DAG (for example, competitor actions) are not driving the mismatch. Review whether the assumptions behind each submodel remain valid (for example, if a price elasticity changed abruptly). If needed, retrain submodels or run new experiments to capture the updated relationship.
How do you validate the DAG’s causal structure itself?
Use domain knowledge, robust experimentation, and available tests (for example, do-calculus or structural equation modeling) to confirm directional assumptions. Whenever feasible, randomize policy variables in small pilot regions. Look for changes in downstream metrics consistent with the DAG. If contradictory evidence emerges, adjust the structure or the edge directions.
How do you incorporate seasonality or external factors (for example, holidays, weather, local events)?
Include additional input nodes that capture these external drivers. Model them directly in each submodel if they have causal influence on rides, driver availability, or user demand. If these factors are unpredictable, treat them as exogenous features with uncertainty distributions. Update them as forecasts from external data sources (for example, weather predictions or holiday calendars).
How would you address extremely sparse training data for a new feature?
Use transfer learning or hierarchical priors based on data from similar markets or related features. Pool data from analogous experiments. Combine domain expertise and partial historical analogies to propose an initial relationship. Then refine as real data becomes available. Provide wide confidence intervals until the new feature gathers enough experimental evidence.
How do you handle potentially noisy or missing data?
Adopt robust data validation rules and impute missing entries conservatively. If data is sporadically missing for certain time windows, build submodels that either ignore that window or approximate the missing variable based on correlated features. Regularly monitor data pipelines for anomalies. If the data is too noisy for stable causal inference, run more controlled experiments or gather additional signals (for instance, user engagement logs).
How can you ensure the solution is not overly complex to maintain?
Maintain a stable DAG structure, with carefully modular submodels. Invest in thorough documentation and automation for model testing, integration, and versioning. Encourage small, incremental updates rather than large rewrites. Train staff in the causal architecture to reduce reliance on a single expert. Keep lines of communication open among teams so they understand each other’s submodels and responsibilities.