
ML Case-study Interview Question: Building an End-to-End Predictive System for E-commerce Recommendations

Browse all the ML Case-Studies here.
Case-Study question
Suppose you have historical user data from a large-scale e-commerce platform that wants to optimize product recommendations by predicting which items each user will likely buy. How would you construct an end-to-end system to ingest user activities, product catalogs, and contextual signals, then build and deploy a predictive model that boosts sales, improves user engagement, and scales to millions of daily interactions? How would you handle data ingestion, feature engineering, model selection, model deployment, and monitoring for continuous improvement?
Detailed Solution
Data Acquisition and Ingestion
Data arrives from multiple sources, including user clickstream logs, user profile attributes, product details, and search queries. The system stores incoming data using a distributed messaging platform for streaming events. A batch system aggregates historical logs. The pipeline must handle both streaming data for real-time updates and batch data for periodic full ingests.
Data Processing and Feature Engineering
Raw clickstream logs contain user browsing behavior, timestamps, product category, user device information, and referral source. A transformation step groups sessions by user to capture sequential patterns. Dimensionality reduction can be used for high-cardinality categorical features, and some user attributes can be one-hot encoded. Interactions between categories and time-of-day can reveal user intent. Session-level aggregates such as total clicks, average session duration, and recency features are constructed. A final feature set includes numeric and categorical variables that represent user activity, product metadata, and session context.
Model Selection
A baseline model uses logistic regression for a binary classification setup that predicts click-through or purchase events. Another candidate uses gradient boosting, which can manage nonlinear relationships more effectively. Neural networks can also be tested, leveraging embeddings for categorical variables. Hyperparameter tuning and cross-validation are applied to select the model that optimizes Area Under the Curve (AUC) and other relevant metrics.
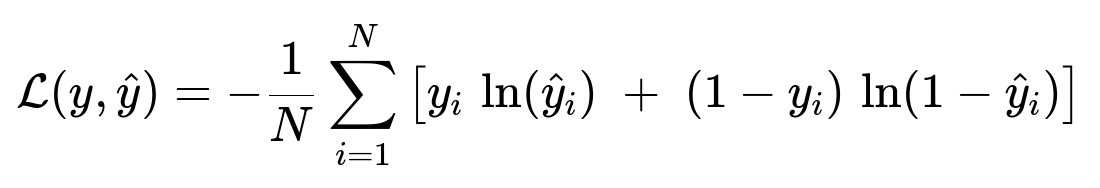
The expression above is the logistic loss function. y_i is the true label (0 or 1). hat{y}_i is the predicted probability of class 1. N is the total number of training examples. ln(...) is the natural logarithm. The function measures the penalty for misclassification, and we aim to minimize this value.
Model Training
Training occurs offline. The data splits into training and validation sets. Distributed frameworks manage large datasets. Gradient-based optimization methods run on GPU clusters for faster training, especially for deep neural networks. Regularization techniques such as L2 penalty or dropout (for neural networks) help to reduce overfitting. Feature selection removes redundant features, improving generalization.
Deployment and Serving
A containerized inference service loads the trained model. The system is accessible via an API endpoint. Real-time features, such as immediate user actions, are ingested through streaming. The model inference layer combines those real-time features with stored profile data. A canary release method tests model performance on a small fraction of traffic before full rollout.
Monitoring and Continuous Improvement
Regular checks measure how the model’s predictions match actual user behavior. Data drift detection triggers retraining or updates to the feature pipeline if the user distribution or product catalog changes significantly. New signals or user behaviors can be incorporated by updating the feature engineering pipeline and retraining the model with fresh data. This cycle iterates continuously.
Example Python Snippet
Below code fits a gradient boosting model using a well-known library. Explanation follows.
import xgboost as xgb
import pandas as pd

# Example DataFrame with features 'X' and target 'y'
X = pd.read_csv("features.csv")
y = pd.read_csv("labels.csv")

params = {
    "objective": "binary:logistic",
    "max_depth": 6,
    "learning_rate": 0.1,
    "eval_metric": "auc"
}

dtrain = xgb.DMatrix(X, label=y)
model = xgb.train(params, dtrain, num_boost_round=200)

# Save model
model.save_model("recommendation_model.json")
This code loads preprocessed feature data and labels, sets parameters, trains a gradient boosting model, and saves the model. The pipeline includes data loading, data transformation, training, and deployment.
Possible Follow-up Questions
1) How would you measure the return on investment of this recommendation system?
Return on investment is measured by comparing key performance metrics before and after system deployment. These include conversion rates, average order value, and revenue per session. A clear experiment with an A/B test isolates the causal impact of recommendations on user purchases. Control and treatment groups see different recommendation models, and differences in revenue or user engagement validate the system’s contribution. Statistical significance testing confirms whether performance improvements are robust.
2) How would you handle cold-start users and products?
Cold-start users lack sufficient history. Bootstrap them with population-level averages, basic demographic signals, or collaborative filtering derived from similar user profiles. Cold-start products benefit from textual and categorical metadata. Embedding-based approaches can map new items into existing feature space via product descriptions and category tags. Once real user interactions accumulate, reassign them from the cold-start cluster to their personalized representation.
3) What are the main performance bottlenecks in the pipeline, and how would you fix them?
Data preprocessing and model training can be bottlenecks. For preprocessing, use distributed engines that parallelize transforms. For model training, scale horizontally by adding GPU or CPU clusters. For online inference, reduce latency by caching features, profiling model response time, and optimizing memory usage. As traffic grows, adopt asynchronous microservices or load-balanced server clusters to handle high request volume.
4) How would you improve model explainability to address stakeholder trust?
Explainability tools such as SHAP (SHapley Additive exPlanations) quantify feature contributions for each prediction. Stakeholders see which factors most influence the recommendation. Surrogate models or partial dependency plots show approximate relationships between features and outcomes. If the system is purely black-box, you can provide local post-hoc explanations that help product managers and compliance teams verify logical decision-making.
5) How do you ensure data quality and consistency in a large-scale environment?
Frequent validations check for missing values, out-of-range timestamps, inconsistent categories, and schema changes. Automatic alerts detect anomalies in data distribution. A versioned data catalog ensures consistent references to specific dataset snapshots. At ingestion, cross-check input fields against expected ranges to stop corrupted records from downstream contamination. Stringent monitoring and a robust data governance process ensure reliable feature engineering.
These strategies address business needs and technology challenges for large-scale recommendation systems. The solution covers ingestion, feature pipelines, modeling, deployment, and iterative improvements. The final approach achieves accurate predictions, scalable inference, and stable performance in real-world settings.