
ML Case-study Interview Question: Gradient Boosting for Personalized Ranking of Multi-Modal Ride Options.


Browse all the ML Case-Studies here.
Case-Study question
A major ride-hailing platform wants to enhance its in-app recommendation system. Multiple transportation modes (various rideshare tiers, bikes, scooters, rentals) are available in select regions, and the system must rank and present these modes to maximize user satisfaction and operational efficiency. The company also aims to introduce dynamic prompts encouraging riders to switch modes after initial requests if real-time factors suggest a more optimal choice (for instance, faster or cheaper). How would you design and implement a robust recommendation system that addresses overchoice, cold start for new products, and ever-changing marketplace conditions while ensuring a seamless user experience?
Provide a step-by-step plan for:
Personalizing recommendations and ranking modes.
Handling cold start challenges and new product launches.
Addressing marketplace balance (supply-demand) when surfacing options.
Optimizing user experience with minimal cognitive load and effective cross-sell prompts.
Detailed solution
Overview of the recommendation framework
Start with a machine learning architecture that predicts user propensity to select each available mode. This framework feeds into a ranking mechanism that determines mode order. A final post-processing step promotes new or strategic modes, ensuring system goals are met even when data is sparse for certain offerings.
Step 1: Data ingestion and feature engineering
Collect user trip history, location, timestamp, supply-demand metrics, mode-level booking trends, and user-specific preferences. Generate features that capture temporal patterns (such as time of day, day of week), user activity levels, and context (for example, estimated wait times, price surges, or promotions).
Step 2: Modeling approach
Apply a gradient boosting model (like LightGBM) to predict the propensity of each user-mode pair. For multi-class classification (one class per mode), the system learns which mode is most probable. For ranking-based objectives (like lambda rank), the system directly optimizes order relevance.
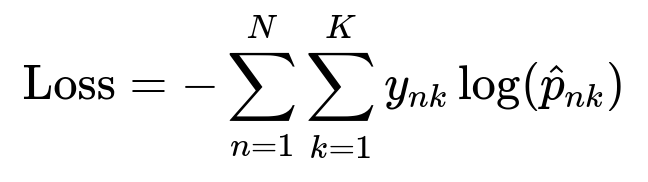
In this expression:
N is the total number of training examples (user-mode instances).
K is the number of possible modes.
y_{nk} is 1 if mode k was chosen for example n, otherwise 0.
hat{p}_{nk} is the model’s predicted probability for mode k.
The training pipeline fine-tunes hyperparameters like maximum depth, learning rate, and number of leaves to reach optimal predictive performance. Distributed hyperparameter search can automate this tuning and iterate quickly.
Step 3: Ranking and preselection
Display the top 3 or 4 modes above the fold. The highest predicted propensity mode can be preselected to reduce user steps. Include fallback logic for new or unobserved users by relying on aggregated popularity data and location-specific usage patterns.
Step 4: Handling cold start for newly introduced modes
Incorporate a post-processing layer that adds a small boost to emerging modes if they lack historical data. Adjust the model’s output to guarantee these modes appear for relevant user segments, ensuring new products gain adequate visibility without overhauling the entire model pipeline.
Step 5: Post-request cross-sell
Implement an interstitial prompt after a user’s ride request. Monitor dynamic variables like price fluctuations and supply-demand changes. When data shows significant benefit (faster arrival or cheaper fare), propose a switch to an alternative mode. Safeguard user experience by limiting triggers to cases with meaningful time or cost gains.
Step 6: Long-term system updates
Introduce a contextual bandit or reinforcement learning approach to adapt to real-time user behavior. Reflect longer-term impacts (for instance, user churn or loyalty) rather than short-term conversions only. Continuously measure how mode suggestions influence future app usage.
Follow-up Question 1: How would you test and evaluate the system to ensure you are measuring the right metrics?
A/B tests measure conversion rates, user engagement, and overall ride volume for each variant of the ranking algorithm. Split users randomly between the existing baseline and the new recommendation framework. Track short-term and longer-term metrics, such as immediate booking rate, average wait time, overall marketplace efficiency, user satisfaction surveys, and retention measures (for instance, how often users return to book again).
In production, real-time dashboards can monitor anomaly signals like unexplained declines in booking rates or rising ride abandonment. If negative trends appear, revert to a safer configuration or roll back the deployment. For further validation, offline replay simulations evaluate potential user decisions based on historical data, though real-world experiments remain the gold standard.
Follow-up Question 2: How do you ensure that models stay updated given shifting user behaviors over time?
Maintain a frequent retraining schedule (for instance, daily or weekly) using fresh trip data. Automate data pipelines so newly collected user interactions flow into the training dataset promptly. Employ an incremental training strategy if full-batch training is computationally expensive.
Monitor data distribution shifts. When the system detects large changes (for example, new usage patterns or novel supply constraints), trigger an immediate training iteration. A fail-safe approach retains the previous model and falls back if the new model underperforms in real-time metrics.
Follow-up Question 3: How do you handle mode selection in new markets with minimal or no historical data?
Build a hierarchical modeling structure: share learned parameters from similar markets or city clusters with matching attributes (population density, ride demand profile, etc.). In the new market, initialize the model with these parameters and allow the recommendation logic to adapt as local data accumulates.
If data is too sparse, adopt a simpler heuristic: rank modes by overall global popularity, with adjustments for known supply constraints. As usage grows, transition to the full machine learning pipeline. Update the post-processing layer to provide a fair boost to new modes for local users.
Follow-up Question 4: How do you address potential bias in favor of certain modes or user segments?
Analyze model outputs across different demographic groups or neighborhoods. If a pattern of bias emerges (for instance, always prioritizing premium rides in high-income areas while under-surfacing affordable options elsewhere), apply fairness constraints in training or post-processing. One practical method is to insert fairness-aware terms into the objective function or set explicit distribution targets for recommended modes.
Examine explainability tools (like SHAP values for gradient boosting models) to see which features drive recommendations most strongly. Identify unintended correlations (for example, location correlated with certain rider attributes) and adjust feature usage accordingly.
Follow-up Question 5: Can you illustrate how you would implement a simple cross-sell logic in Python?
A minimal approach could watch for potential gains in wait time or price after a ride is placed:
def cross_sell_prompt(current_mode, alternative_modes, user_location):
    # existing request details
    curr_price = get_current_price(current_mode, user_location)
    curr_eta = get_current_eta(current_mode, user_location)

    best_option = None
    for mode in alternative_modes:
        alt_price = get_current_price(mode, user_location)
        alt_eta = get_current_eta(mode, user_location)
        if alt_eta < curr_eta * 0.8 or alt_price < curr_price * 0.8:
            if not best_option or (alt_eta < best_option["eta"]):
                best_option = {"mode": mode, "price": alt_price, "eta": alt_eta}

    if best_option:
        return (f"Consider switching to {best_option['mode']} "
                f"for ETA {best_option['eta']} min or price ${best_option['price']}.")
    else:
        return None
This function continuously checks if an alternative mode offers at least 20% faster arrival or 20% cheaper cost. It proposes the first best candidate. More sophisticated strategies can consider user propensity scores or the impact on marketplace balance.
Follow-up Question 6: What if the system’s predicted best mode leads to repeated negative user feedback or cancellations?
Track real-time cancellations or explicit user feedback (like rating or quick post-ride comments). If a pattern shows frequent drops in ride completion or repeated negative feedback for a certain recommended mode, dynamically lower that mode’s propensity score or apply a penalty factor. The pipeline can incorporate these metrics into the training process, building negative signals into the objective function. Quick rollbacks for the feature flags controlling mode ranking can mitigate user dissatisfaction while diagnosing and solving the root cause.
Follow-up Question 7: How do you plan for long-term improvements and new initiatives, such as one-tap shortcuts and reinforcement learning?
Iterate steadily:
Expand coverage of one-tap shortcuts by identifying user segments prone to repeated destinations or specific modes.
Integrate a reinforcement learning layer (contextual bandit) to optimize immediate rewards (conversions, user satisfaction) while also accounting for long-term outcomes (repeat usage, user loyalty).
Perform staged rollouts to ensure stability. Start with small user subsets, monitor performance metrics, and scale incrementally.
Frequent experimentation and user-feedback loops guarantee the recommendation system evolves with changing conditions and usage patterns.