
ML Case-study Interview Question: Quantifying Ad Tier Uplift using Monotonic LightGBM for Marketplace Listings


Case-Study question
A large online marketplace offers several tiers of advertising packages for its automotive listings. Higher-tier packages provide more prominent positioning in search results, leading to potentially higher visibility and faster sales. The company wants to quantify the effect of upgrading (or downgrading) a package on each customer’s listings. They collect features describing each listed vehicle (such as age, price, make, model, and other predictors of performance), and they have labeled data for daily search impressions and advert views.
They notice that the package tier is strongly correlated with other features, such as vehicle age or retailer type. They also want to enforce that higher-tier packages never reduce a vehicle’s exposure. The task is to build a machine learning model that predicts daily advert performance under each possible package tier, and then converts these predictions into a percentile-based performance score shown to customers in a transparent dashboard.
Propose a solution for this. Explain how you would design the feature set, address correlations between features, handle monotonic constraints, build and deploy the model daily, and generate the final performance rating metric. Include details of the model architecture and your plan for explaining the results to internal stakeholders and customers. Consider constraints of interpretability, potential biases, real-time or near-real-time data pipelines, and the need to adapt the model as customer behavior changes.
Detailed Solution
Overview
The main objective is to isolate and estimate the effect of a package tier on search impressions and advert views for each vehicle. The solution must handle significant correlations between package tier and other predictive factors. The system also needs to enforce that upgrading a package cannot reduce a vehicle’s predicted performance.
Choice of Model
A tree-based ensemble model is appropriate due to the non-linear relationships. LightGBM is suitable because of its handling of large datasets, speed, and monotonic constraints. The plan is to train two LightGBM regressors. One predicts log search impressions, and the other predicts log advert views.
log_search_appearances = f1(features, package_tier)
log_advert_views = f2(features, package_tier)
These equations refer to the daily predicted log search impressions and log advert views. Features include age of the vehicle, location, price vs. valuation metrics, advert attractiveness score, and any other relevant attributes.
Addressing Correlated Features
Training data must capture vehicles listed under different packages, so the model can separate the impact of package from the vehicle’s intrinsic appeal. High correlation can distort the package effect if the model mistakes some other attribute (like brand reputation) for package influence. Gathering diverse samples across multiple package tiers reduces this risk. LightGBM’s inherent ability to capture interactions is important. Including monotonic constraints on package tier addresses the requirement that upgrading tiers cannot reduce response.
Monotonic Constraints
LightGBM’s monotonic constraints let you specify that increasing package tier never yields a lower predicted response. Setting this constraint ensures interpretability and is justified because the marketplace’s mechanics give higher-tier packages more visibility. The dataset must still reflect real-world noise, so validating model accuracy without the monotonic constraint versus with it confirms no large misalignment.
Daily Pipeline
The system needs daily retraining to track changes in user behavior. Each day’s pipeline is:
Retrieve historical data of impressions and advert views.
Calculate input features such as vehicle descriptors, pricing metrics, and advert attractiveness.
Train the two LightGBM models on the latest data (with monotonic constraints).
Predict daily performance on each advertising tier for every active advert.
Convert predictions to a percentile-based performance rating for use in dashboards.
Performance Rating Metric
Predictions are aggregated into a percentile score among comparable adverts. Each advert’s performance rating is computed in a way that respects the difference in predicted performance from one package tier to another.
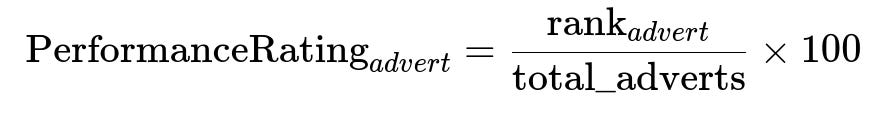
Here rank_{advert} is that advert’s position (with predicted performance) among similar adverts, and total_adverts is the total comparable group. This yields a 0–100 scale. Any jump when upgrading the package translates into a higher percentile score.
Explaining Results
Internal stakeholders see the package-level uplift in daily reports. This includes summary statistics of average improvements in search impressions and advert views for each tier. Customers see a simplified view. Their dashboard shows the percentage of their stock expected to achieve “Low,” “Below Average,” “Above Average,” or “Excellent” performance ratings at each tier. This helps them decide if the package cost is justified by the predicted response gain.
Practical Implementation
A Python-based ETL pipeline orchestrated by a scheduler (for example Airflow) automates the daily workflow. LightGBM’s training code might look like:
import lightgbm as lgb

train_data = lgb.Dataset(X_train, label=y_train)
params = {
    "objective": "regression",
    "monotone_constraints": "1",  # or a custom array specifying monotonicity for each feature
    "learning_rate": 0.05,
    "num_leaves": 31,
    "feature_fraction": 0.8,
    "bagging_fraction": 0.8,
    "bagging_freq": 5
}
model = lgb.train(params, train_data, num_boost_round=1000, valid_sets=[train_data])
predictions = model.predict(X_test)
The pipeline then merges predictions for each advert across all package tiers into a matrix, transforms them into performance ratings, and saves them in a data store for dashboards.
Follow-Up Questions
1) How do you prevent the model from over-attributing improvement to the package tier instead of other correlated features?
The model can overestimate the package effect if the training data is not representative. Ensuring the dataset spans a wide variety of vehicles and retailers across each package tier is crucial. Including features for age, price, and brand clearly signals the model about these factors. Cross-validating predictions for adverts that switch tiers reduces the risk of misattribution because the model sees the same advert at different package levels. Regularly checking feature importances and partial dependence plots helps confirm that the package feature’s effect is reasonable compared to other features.
2) Why use log transformations for search impressions and advert views?
Search impressions and advert views range from a handful per day to many thousands. Model stability is improved by predicting in log space to focus on proportional accuracy rather than absolute error. Predicting raw impressions can skew training toward high-traffic listings only. Transforming to the log scale penalizes errors proportionally for small and large listings alike.
3) How do you evaluate the correctness of monotonic constraints if real data sometimes shows no uplift for certain adverts?
Occasionally, random or domain-specific noise might indicate no uplift for certain adverts. The monotonic constraint ensures predictions never decrease, so the primary validation is whether the model’s overall accuracy remains high and whether real-world observations confirm the upward trend. If a small subset of adverts sees no genuine benefit, it is still consistent with an overall upward shift since differences might be within the model’s margin of error.
4) How do you ensure that the performance rating does not confuse customers with dramatic changes caused by small numerical differences?
Calibration is key. The rating is percentile-based, which is robust to small numeric variations. Before the daily refresh, the model sorts adverts by predicted performance. If many adverts cluster around similar predicted values, they share the percentile range. Communicating the rating categories (“Low,” “Below Average,” “Above Average,” “Excellent”) smooths out small changes. Rapid swings are still possible for fringe cases, but the daily retraining and stable input features help maintain consistency.
5) How do you handle distribution shifts or changes in user behavior over time?
The daily pipeline inherently adapts to small shifts. If a major shift occurs, such as seasonal patterns or changes in consumer behavior, retraining every day ensures fresh data. Anomalous shifts can be detected by monitoring error metrics (MAE or MAPE) on a validation set. Large performance drops trigger deeper investigations. Frequent re-checks of the model’s monotonic constraints and feature distributions help reveal any mismatch between the model’s assumptions and emerging realities.
6) Could you apply this method if some high-tier packages are used only by a small fraction of sellers?
LightGBM can handle imbalanced data, but extreme data sparsity for top packages can harm learning. One approach is data augmentation or modeling. Another approach is to group certain tiers together if they are structurally similar, at least until more data is collected. Monitoring performance metrics for rare tiers is essential. If insufficient data persists, it might be necessary to relax monotonic constraints or gather more representative data to confirm the true package uplift.
7) How do you confirm that the solution is fair for all types of customers?
Fairness requires verifying that the model is not systematically favoring specific customer segments. Evaluating predictions across retailer types (independent, franchise, etc.) and vehicle classes helps detect bias. Calculating error metrics for each sub-group reveals potential disparities. If unfair patterns are uncovered, adjusting features, adding new relevant attributes, or further stratifying the training set can correct the bias. Using monotonic constraints only for the package tier ensures that fairness adjustments are not overridden by forced monotonic behavior on other correlated variables.
8) How would you extend the solution to other product lines or content beyond automotive?
The architecture of daily data refresh, LightGBM modeling, and percentile-based performance rating is not specific to automotive. Adaptation for other products involves re-defining the target outcomes, adjusting input features, and confirming the effect of different promotional tiers. The same pipeline structure can be reused: collect data, train a model that respects monotonic constraints for tiered features, predict outcomes for each tier, and convert those predictions into a percentile-based metric that is meaningful to the new domain’s customers.
9) How do you tackle interpretability for non-technical stakeholders?
Tree-based methods can be explained with feature importance, SHAP (SHapley Additive exPlanations), or partial dependence plots. Explaining how higher package tiers shift predicted performance upward is simpler with a monotonic constraint. Offering a dashboard that shows predicted search impressions or advert views, and the resulting rating changes, helps illustrate the return on investment. When needed, short textual explanations, examples of real adverts’ results under different tiers, and stability metrics help build trust among non-technical teams.
10) How do you maintain model reproducibility as the system evolves?
Version each model build with training parameters, data timestamps, and feature sets. Store model artifacts, training logs, and environment dependencies in a central repository. Tag each daily run with a unique identifier so any day’s predictions can be recreated. This helps debug or compare performance across different model revisions or feature sets. Documenting these steps ensures consistent, auditable pipelines as the system expands and new models are introduced.