ML Case-study Interview Question: Predictive Fashion Inventory Optimization Using UMAP Embeddings and Simulation
Browse all the ML Case-Studies here.
Case-Study question
A large online retailer wants to build a machine-learning-based inventory recommender system for fashion items. The goal is to expand their merchandise and optimize purchases for an ever-evolving client base. They need to quickly evaluate each new item’s potential performance across various client segments, then simulate how inventory decisions might affect overall business metrics. You are asked to architect a solution that processes raw inventory data, applies advanced modeling, and produces actionable insights for buyers and partners. You have access to diverse data, such as product images, text descriptions, metadata on fabrics, human-generated product attributes, and client-item interaction data. You must detail how you would build, train, and evaluate this system. You also need to demonstrate how you would integrate this recommender into design workflows (AI-assisted design), vendor onboarding, and real-time decision-making around sustainability and cost reduction. Propose a comprehensive blueprint for the solution, explain which models you would use and why, discuss how to handle dimensionality reduction, describe a robust model management strategy, and show how you would test the approach with business-specific metrics.
Detailed Solution
Overview of the Approach
This system must handle large-scale item data from multiple sources. One component extracts and unifies features from diverse data streams. Another component trains predictive models on these features to forecast item-level performance. Finally, a simulation layer tests how different inventory decisions might improve business metrics.
Data Sources and Feature Extraction
Existing catalog items have many attributes. New (“proto-merch”) items need similar attributes. Combine metadata from buyers with automatically extracted visual descriptors from a computer vision pipeline. Use text embeddings and fabric attributes to capture aspects of color, shape, texture, and style. Represent each new item as a vector containing numerical and categorical features.
Implement an “imagery extender” to generate embeddings from product photos. Apply natural language processing on textual descriptions to glean brand-specific or style-specific attributes. Capture fabric feel from structured metadata. Concatenate all these into a common feature space.
Dimensionality Reduction
High-dimensional feature vectors can be sparse. Use a manifold-based method to produce compact embeddings for model training. One popular technique is Uniform Manifold Approximation and Projection (UMAP). This step boosts modeling speed and performance.
Below is an example Python snippet illustrating the dimensionality-reduction pipeline:
import umap
import numpy as np

# Suppose 'item_features' is an N x 500 matrix
# representing 500-dimensional item vectors.
# We'll reduce to 8 dimensions.

reducer = umap.UMAP(n_components=8, random_state=42)
item_embeddings = reducer.fit_transform(item_features)
This code transforms high-dimensional vectors into 8-dimensional embeddings. Each row in item_embeddings then becomes the training input for downstream models.
Core Modeling Techniques
Train multiple regression or classification models to predict an item’s success in different client segments. For example, define success as “likelihood of a positive rating” or “probability of purchase.” Each item’s ground truth label comes from historical interactions or known outcomes for similar items.
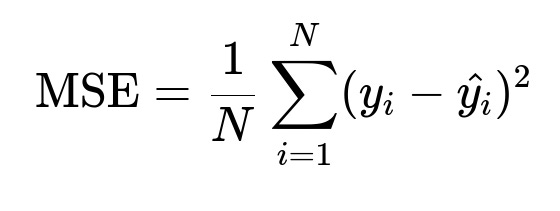
Traditional metrics like mean squared error (MSE) are often insufficient for gauging business impact, but we can still reference its typical form:
MSE is straightforward, but it does not clarify if the predictions translate into better buying decisions. A more effective approach is to devise custom, business-facing metrics (for instance, total revenue from a simulated buy or fraction of items that achieve a specific success threshold).
Model Management and Business-Facing Metrics
Each trained model is evaluated against real-world buyer decisions. Create a simulation that replicates how buyers choose merchandise. Rank items based on predicted success. Then simulate shifting purchase volumes away from poorly rated items toward higher-scoring items. Compute gains in projected performance, revenue, or client satisfaction. Compare this simulation to an ideal “crystal ball” scenario. The gap highlights how much additional value better models might deliver.
Deploy models through a versioning system that catalogs performance by merch category (like men’s jeans, women’s knit tops, etc.). Continually track how each model interacts with buyer decisions.
Inventory Simulations
Buyers often choose which variants (color, pattern, silhouette) to buy in each merch node. Mimic these decisions by using predicted performance to shift allocations. Compare the resulting performance to actual historical performance. Identify subcategories where the model outperforms and areas that need further work.
AI-Assisted Design
Integrate the recommender system early in the design phase. Predict how specific cuts or patterns might perform before fabrication. Provide immediate feedback on probable success. Shorten the cycle from conceptualization to testing. Improve sustainability by reducing wasteful production.
Vendor Evaluation
Calculate predicted success for each vendor’s portfolio to see if adding that vendor broadens the assortment appeal or captures a strategic audience. Generate vendor reports that show where they align best with core or emerging markets. Use these insights to onboard vendors who fill gaps or optimize existing vendor relationships.
Final Architecture
A data pipeline fetches attributes, merges them, and passes them into a dimensionality reduction process. A training and model management layer then produces predictions for each merch node. A simulation module quantifies business impacts. Real-time dashboards allow buyers and designers to view recommended actions (such as volume allocations or next pattern iteration).
Follow-Up Question 1
How do you ensure that custom business-facing metrics are more suitable than typical ML metrics like MSE or accuracy?
The business needs actionable insights, not just lower error terms. MSE or accuracy do not reveal whether the model’s error is relevant in a real-world buying context. A small drop in MSE might still leave you buying large volumes of poorly performing items. Construct metrics based on actual decision points. For instance, measure revenue lift or absolute improvement in the top 10 percent of items purchased. This alignment between model outputs and real buyer actions ensures that your metrics meaningfully reflect progress toward business goals.
Follow-Up Question 2
How do you handle new, unseen items where there is minimal historical data?
Borrow information from existing, similar items using shared attributes. Rely heavily on feature engineering, especially embeddings derived from item images and text descriptions. Generate an embedding for the new item, then measure distance to established items with known performance. Build a meta-model that extrapolates success from neighbors. This cold-start approach can reduce uncertainty for new products.
Follow-Up Question 3
How do you address potential bias or inequity in the system?
Systematic biases might arise if historical data reflect incomplete or skewed client segments. Mitigate this by calibrating predictions across different demographic or style-preference subsets. Audit model outputs to detect patterns of bias. Expand the training set to ensure fair representation of various body types, budgets, and fashion tastes. Add periodic checks that measure performance across demographic slices to confirm that no single group is systematically disadvantaged by the recommendations.
Follow-Up Question 4
How do you justify your dimensionality reduction choice?
Unlike methods that sacrifice local distances in favor of global structure, UMAP preserves local neighborhoods. This is critical for items that are subtly different in attributes like color or fabric. Reducing from hundreds of features to a manageable dimension set allows more efficient model training without losing the fine-grained distinctions essential for style and fit preferences. t-SNE might yield visually appealing clusters but can be slower at scale and less convenient for production. Principal Component Analysis (PCA) is simpler but may not capture non-linear relationships as effectively.
Follow-Up Question 5
What does your final deployment pipeline look like, and how do you handle model updates?
Build a data pipeline that routinely fetches new item attributes. Run these attributes through the feature extenders (imagery, text, metadata). Apply UMAP or another transformation. Pass embeddings into the predictive model. Store predictions in a results table. An orchestration tool triggers simulations or dashboards used by buyers. For updates, version each model in a model registry that logs performance metrics and relevant hyperparameters. When a new model outperforms the old one on critical business measures, trigger a controlled rollout.
Follow-Up Question 6
How would you manage stakeholder buy-in and trust?
Present simulation-driven outcomes that demonstrate how small changes in purchase volume can drive tangible gains in sales or client satisfaction. Provide interpretable breakdowns of why a model favors certain items. Show how decision boundaries shift inventory strategies. Maintain consistent collaboration with merch teams to refine or validate the custom metrics. Frequent communication and demonstration of results in real scenarios ensure stakeholders see measurable benefits.
Follow-Up Question 7
How would you adapt the system for a broader market expansion?
Revisit segmentation logic to ensure new client groups have well-represented data. Capture fresh images, text, or style attributes relevant to the expanded clientele. Update the embedding methods to incorporate any novel product attributes (like culturally specific patterns). Re-run your simulations with new client segments. Evaluate potential inventory expansions that cater to emerging markets. If certain data are sparse, explore external data or strategic sampling methods to accelerate learning for the new segments.


