
ML Case-study Interview Question: Cascade Modeling: Improving GBM Holiday Forecasts via Linear Correction.


Browse all the ML Case-Studies here.
Case-Study question
A large consumer-facing platform faces sharp fluctuations in supply and demand during major holidays. The core forecasting model is a gradient boosting machine that struggles to handle extreme outliers and limited holiday data, leading to inaccurate predictions around holidays. You need to design a machine learning solution that produces reliable forecasts for both holiday and post-holiday periods without sacrificing recent historical data. Propose a strategy, explain how you would ensure scalability across thousands of geographies, and outline how you would validate your approach. Address potential issues in experimentation where sample sizes are small due to the rarity of holidays.
Detailed Solution Approach
A tree-based model such as gradient boosting or random forest often fails to adjust for large swings during rare events. Holidays fall into this category. Training data for holidays is sparse, so the model lumps holidays into the same leaf node and averages them, producing large errors. One effective way to mitigate this problem is the cascade modeling approach. It augments the main gradient boosting machine (GBM) model with a holiday impact estimator to strip out the holiday effect from historical data, train the model on those corrected observations, and then add the holiday effect back to future predictions. This process preserves the most recent trends and prevents major spikes or dips from skewing next week's forecast after a holiday.
Core Formula for Holiday Impact Estimation
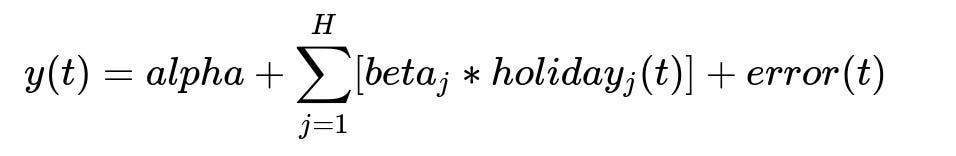
Here:
alpha is the intercept of the regression.
j indexes each holiday in a set of H holidays.
beta_j is the estimated coefficient for holiday j.
holiday_j(t) is a binary indicator that is 1 on holiday j, otherwise 0.
error(t) is the residual at time t.
This linear regression gives a holiday multiplier for each holiday. For example, if beta_j is -0.4, then the multiplier indicates a 40% drop on that holiday compared to a regular period. After calculating multipliers for each location-daypart pairing, those values are used to adjust historical holiday data. This produces a "holiday-free" history for training the GBM. In inference, the GBM gives a baseline forecast, which you then re-scale by inverting the multiplier to restore the holiday impact.
Implementation Details
A python-based Spark workflow can compute these multipliers at scale. A possible code snippet, written in simple form, might look like:
import pandas as pd
from pyspark.sql import SparkSession
from sklearn.linear_model import LinearRegression

spark = SparkSession.builder.getOrCreate()
data = spark.table("historical_data")

# Convert Spark DataFrame to pandas for illustration
df = data.toPandas()

# Group by location and daypart
group_keys = df[['location_id', 'daypart']].drop_duplicates()

multipliers_list = []

for idx, row in group_keys.iterrows():
    location_data = df[(df['location_id'] == row['location_id']) & (df['daypart'] == row['daypart'])]
    X = pd.get_dummies(location_data['holiday_label'])  # holiday_label indicates specific holiday
    y = location_data['target']                        # target might be order volume or supply
    model = LinearRegression()
    model.fit(X, y)
    holiday_coef = model.coef_                         # Coefficients per holiday dummy
    holiday_names = X.columns
    # Save coefficients, which become multipliers
    # Suppose we interpret a negative coefficient as a fraction decrease
    for name, val in zip(holiday_names, holiday_coef):
        multipliers_list.append({
            'location_id': row['location_id'],
            'daypart': row['daypart'],
            'holiday': name,
            'multiplier': 1 + (val / model.intercept_) if model.intercept_ != 0 else 1
        })

# multipliers_list can be turned into a Spark DataFrame and stored for further use
The holiday_label column in the snippet identifies each holiday. The holiday multipliers get stored for large-scale training later. This approach scales by distributing computations across workers, which is essential when you have thousands of geographies and multiple dayparts.
After computing multipliers, you apply them to correct the actuals. For a day labeled as a holiday with multiplier m, the corrected actual is actual / (1 - drop_fraction) or actual * factor. You then train the GBM on these corrected actuals. During inference, the GBM produces a forecast that assumes no holiday effect, so you finally post-process it with the appropriate holiday multiplier if the prediction date is a holiday.
Accurate wMAPE (weighted mean absolute percentage error) improvements result because the main model no longer sees extreme outliers in its training data. You also avoid messing up the week after a holiday since the model does not carry forward that anomaly. The cascade approach leads to better reliability across the entire time series.
Follow-Up Question 1
How do you ensure that removing holiday effects does not lose other meaningful patterns that might occur around major events?
Answer Explanation Including a separate linear model for holiday impact is crucial. You only remove the portion explained by the holiday dummy coefficients. If there is extra demand or supply variation preceding or following a holiday, the GBM still has that data since only the direct holiday day(s) are corrected. Also, your features for day-of-week, day-of-year, or special promotions remain intact. The linear model only targets the days flagged as holidays. The corrected time series still reflects other short-term fluctuations, so the model can learn them.
Follow-Up Question 2
Why not build a completely separate model just for holiday dates and another for non-holiday dates?
Answer Explanation Holiday data are sparse. Training a separate holiday model would provide only a handful of yearly observations. The model for regular days would then ignore the most recent holiday data, which might be important for the days immediately following the holiday. The cascade approach corrects holiday observations without discarding them, ensuring that short-term trends remain available to the main model.
Follow-Up Question 3
How would you validate this new approach, especially if you have few holiday events each year?
Answer Explanation Backtesting on historical holidays is a strong first step. You measure accuracy on known events like Thanksgiving and Christmas. You also evaluate cost impacts and supply quality. In production, a small-scale or partial-market A/B experiment can confirm that forecasts do not degrade real-world performance. Even though statistical power is low, you only need to confirm no harmful effect, not necessarily a large improvement. Showing stable or better service levels over multiple holidays helps convince stakeholders.
Follow-Up Question 4
What do you do if some dayparts or locations show inconsistent multipliers that occasionally inflate errors?
Answer Explanation You can smooth multipliers by combining or regularizing outliers. If a single holiday coefficient is drastically different from known patterns, the system can clamp or average it with related geographies or dayparts. You can also apply prior knowledge that certain locations do not experience the same holiday effect. This ensures no extreme multiplier skews the final predictions. A robust pipeline might include thresholds for discarding or down-weighting unrealistic multiplier values.
Follow-Up Question 5
How do you handle network effects in experimentation where a holiday pay change in one location might affect Dasher behavior in a neighboring location?
Answer Explanation Full isolation is difficult. A standard geo-split or switchback experiment would risk contamination if Dashers cross boundaries. You can run a carefully selected set of markets that are geographically distant to reduce interference. You can also rely on historical backtests and smaller-scale experiments to ensure no major adverse network shifts. If truly isolated A/B is not possible, you collect data on cross-market Dasher migrations to see if they spike in the treatment region. If they do, you factor that into the final decision.
Follow-Up Question 6
Why not switch to a deep neural network for forecasting holiday volumes?
Answer Explanation Neural networks can capture complex patterns but also need large amounts of well-labeled data for extreme events. Holidays are rare and vary drastically, so the neural network might overfit or require heavy regularization. The cascade solution provides a practical fix that reuses your existing GBM pipeline and minimal changes while addressing the main holiday problem. If you later have enough data, a hybrid approach could incorporate learned holiday embeddings, but the linear-correction-plus-GBM approach is simpler to maintain now.
Follow-Up Question 7
What are the main operational pros and cons of implementing the cascade approach?
Answer Explanation A pro is significantly improved holiday forecasts, reducing supply-demand mismatches and potential lost revenue or poor service. Another pro is the straightforward interpretability of holiday multipliers when explaining results to operations and finance. A con is that you add complexity with extra regression jobs and post-processing. Another con is the possibility of stale multipliers if holiday behavior shifts. But for businesses with stable annual holiday patterns, the benefits are often substantial.