
ML Case-study Interview Question: End-to-End Machine Learning for Real-Time E-commerce Product Ranking at Scale.

Browse all the ML Case-Studies here.
Case-Study question
A large-scale e-commerce platform stores billions of product interactions each day. Customer engagement needs improvement through personalized recommendations. Management wants a plan to build and deploy a machine learning system for product recommendation on a tight timeline. Data comes from transactions, product metadata, user profiles, and session logs. The goal is to predict the next product interaction with high accuracy and then rank items effectively, especially in real-time scenarios. The question is how you would design and implement an end-to-end solution that meets these requirements, including data ingestion, feature engineering, model training, deployment, and ongoing optimization. Propose the architecture, explain data handling, model choices, training approach, key metrics, deployment details, and how you would maintain or iterate on this solution.
Detailed Solution
Data flows in from transactional logs, user profile databases, and product catalogs. A batch layer aggregates historical data in a data warehouse. A streaming layer ingests real-time events for quick updates. A feature store acts as a central hub for storing aggregated user and product features. Model training uses labeled data created from user click and purchase history.
Feature Engineering and Modeling
User features include session behavior, user preferences, and purchase history. Product features include product category, price range, textual descriptions, and historical popularity. Interaction labels come from clicks and conversions. A deep neural network or gradient boosting model captures complex relationships. A classification model outputs probability of user engagement for each candidate product.
Core Mathematical Formula for Classification Probability
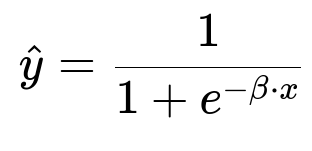
Parameter vector beta represents learned weights, and x represents the feature vector for a user-product pair. Model outputs a probability of engagement. Ranking uses these predicted probabilities. A higher predicted value means stronger likelihood of interaction.
Training Strategy
Data splits into train, validation, and test sets. Training data covers a broad time span, validation data comes from a later time window for unbiased evaluation, and test data is from the most recent window to reflect current user behavior. Hyperparameter tuning uses the validation set. Early stopping and regularization avoid overfitting. Mini-batch gradient descent speeds up training. The model is retrained weekly or daily as new data arrives.
Loss Function
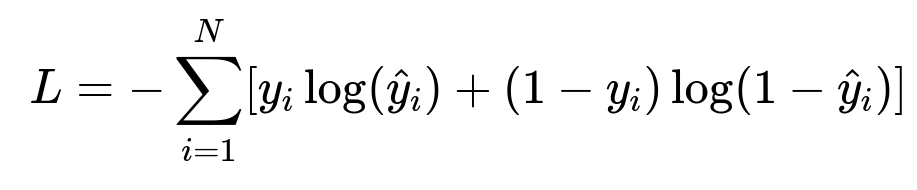
N is the total number of user-product interactions in the training set, y_i is the binary label indicating engagement, and y-hat_i is the model’s predicted probability for that interaction.
Deployment
A containerized inference service handles incoming requests. The service retrieves up-to-date user and product features from the feature store. The trained model ranks items. A caching mechanism minimizes latency. A model monitoring system tracks prediction drift, feature distribution shifts, and overall performance. Regular retraining updates model parameters with fresh data.
Example Python Code
import numpy as np
from sklearn.model_selection import train_test_split
from sklearn.ensemble import GradientBoostingClassifier
from sklearn.metrics import roc_auc_score

def build_model(features, labels):
    x_train, x_test, y_train, y_test = train_test_split(
        features, labels, test_size=0.2, shuffle=True
    )
    model = GradientBoostingClassifier(n_estimators=100, learning_rate=0.1)
    model.fit(x_train, y_train)
    preds = model.predict_proba(x_test)[:, 1]
    score = roc_auc_score(y_test, preds)
    return model, score
The build_model function trains a gradient boosting model. x_train and y_train are used for training. x_test and y_test are reserved for evaluation. The predicted probabilities are stored in preds. roc_auc_score is computed to measure performance.
Ongoing Optimization
Data drift monitoring ensures feature distributions remain consistent. Retraining triggers if drift crosses a threshold. Periodic A/B tests compare new models against production. Feature pipelines evolve with updated user or product data. Model performance is tracked through metrics like area under the ROC curve, coverage rate, and click-through rate improvements.
Follow-up question 1
What technique ensures fresh user behavior is captured in the model without overfitting?
Answer
Incremental training or frequent batch retraining updates the model with new data. A time-based validation strategy checks for robustness on recent user behavior. A rolling window approach ensures the model learns evolving patterns without memorizing stale data. Clear separation of training and future data prevents label leakage.
Follow-up question 2
How would you address cold-start problems for new products or new users?
Answer
A content-based recommendation approach uses product metadata like category, price, and textual descriptions when user interaction history is sparse. Profile-based similarity for new users leverages regional or demographic features to estimate preferences in the absence of personal transaction data. A hybrid approach combines collaborative and content-based signals for better coverage.
Follow-up question 3
Why is a feature store useful in this architecture?
Answer
A feature store standardizes the process of reading and writing features. It maintains consistent definitions of features across teams, ensures reproducibility between training and inference, and drastically reduces errors from mismatched feature transformations. Real-time features and historical aggregates can be accessed from one system.
Follow-up question 4
How do you handle ranking at scale when millions of products exist?
Answer
A candidate generation phase narrows down the vast catalog to a manageable set based on product popularity, user segments, or approximate nearest neighbors. The final ranking model scores only these shortlisted candidates. This two-stage approach avoids inference over the entire catalog, which is computationally expensive.
Follow-up question 5
What metrics indicate success?
Answer
Area under ROC curve or precision-recall assess predictive power. Click-through rate improvement shows engagement. Conversion rate or add-to-cart metrics evaluate direct business impact. Coverage rate reveals how many items are recommended at least once. A/B test lifts confirm that personalized recommendations outperform control settings in real production usage.
Follow-up question 6
How do you handle real-time model updates?
Answer
A streaming pipeline collects interactions as they happen. A near-real-time processor aggregates user sessions. Features get updated in the feature store. A continuous or frequent training job picks up updated data snapshots. The deployment system swaps in the new model version with minimal downtime and watches performance metrics closely.