
ML Case-study Interview Question: Scalable Machine Learning for Accurate Rental Property Revenue Forecasting.

Case-Study question
A popular rentals platform wants to predict the yearly revenue of newly listed properties. The platform collects data on the property’s attributes (number of bedrooms, bathrooms, square footage, and other features), location data (distance to city centers, major attractions), pricing details (owner’s nightly rate, occupancy limit), and local market data (prices of nearby listings, occupancy rates). The business need is to show new hosts an estimated yearly revenue to help them set expectations and guide them on how to price or market their listings. The question is how to design and implement a machine learning approach to make these predictions at scale, while ensuring data quality and handling missing information for key predictors like square footage.
Detailed solution
Understanding the core objective
Generate yearly revenue estimates for newly listed properties using available property, location, and market data. Predictive accuracy matters, but interpretability and ease of deployment can affect model choice. Reliability is also critical because the platform expects high queries per second.
Data collection and preprocessing
Collect property details (bedrooms, bathrooms, square footage, kitchen availability), pricing information (nightly rate, occupancy limits, minimum nights), location data (zip code, distance to attractions), and local market stats (average rates, historical occupancy for similar listings).
Check for duplicates by verifying unique listing identifiers. Confirm data type consistency to avoid mix-ups between numerical columns like price and categorical columns like zip code. Standardize numerical fields by normalizing or scaling them. Encode categorical variables (kitchen availability, property type) into binary or ordinal formats.
Handling missing or sparse features
Fill missing data through targeted imputation strategies or a sub-model for predicting key features, such as square footage. Leverage external sources or user prompts to fill in missing property data. Address sparse features by feature selection or dimensionality reduction (PCA), or by using models robust to sparsity, such as random forests or boosted trees. Neural networks can also cope with sparse inputs if properly regularized or if embedding layers are applied.
Model building and evaluation
Start with a simpler baseline like linear regression to understand the relationship between predictors and yearly revenue. If non-linear interactions or complex patterns appear, consider random forest, gradient boosting (XGBoost), or a neural network.
For linear regression, represent the prediction function as
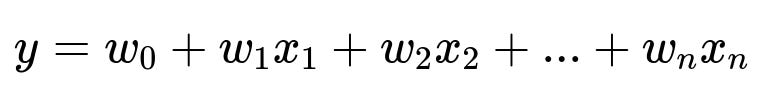
where y is the target yearly revenue, x_i are property and market features, and w_i are learned weights capturing each feature’s influence. This simpler model provides interpretability, uses less compute, and is easy to deploy. Larger training data volumes and more intricate relationships justify models like random forests or deep networks, which can capture non-linearities but may require more resources and careful tuning to avoid overfitting.
Deployment considerations
Balance model complexity and infrastructure cost to meet high queries per second (QPS). Provide enough compute resources or consider model distillation if a complex model is too large. Build a data pipeline that regularly retrains or updates the model with fresh listings data. Incorporate monitoring dashboards to track inference latency and accuracy metrics in production.
How would you handle missing square footage for 10% of the properties?
Train a sub-model to predict square footage using related features such as number of bedrooms, bathrooms, or total occupancy allowed. Prompt users to provide missing information, or use external datasets (county records, parcel data) to find approximate square footage. Tagging missingness as a potential signal can also help. Avoid one-size-fits-all imputation since it may mask the true distribution and lead to inaccurate estimates.
How do you address the curse of dimensionality with hundreds of features?
Apply feature selection to discard features with low variance or no relationship to the target. Consider correlation analysis and variance inflation factors to pinpoint redundant predictors. Use dimensionality reduction methods (PCA) to combine correlated features into smaller latent representations. Keep interpretability in mind when engineering principal components, because purely transformed features can lose transparency.
Why might a random forest or boosted model be preferred over a neural network?
Random forests and boosted trees handle smaller datasets better and are less prone to extreme overfitting. These tree-based methods manage sparse data more gracefully. Tuning hyperparameters is often more straightforward. A neural network may perform better with vast datasets and highly complex patterns but needs careful regularization, can be harder to interpret, and often requires more computational resources.
How do you deploy a model that must answer a high number of queries per second?
Quantify the expected traffic to size the infrastructure. Choose a smaller, efficient model (like a simplified tree ensemble or a distilled neural net) if resources are limited. Use a load balancer to distribute inference requests, and cache results if many requests share similar inputs. Evaluate the trade-off between predictive accuracy and computational cost to find a viable deployment plan.