
ML Case-study Interview Question: Tunable Beta-Binomial Exploration for Optimizing Travel Accommodation Rankings


Browse all the ML Case-Studies here.
Case-Study question
A large travel aggregator needs to rank accommodations from thousands of possible matches. They want to select the top 25 accommodations for each user in a way that balances using known high-performing options (exploitation) with discovering potential new high performers (exploration). The aggregator has a ranking system that relies on historical performance data. They notice this system is too greedy and rarely tries unknown inventory. They decide to incorporate an exploration mechanism into their ranking model. Propose a solution approach that includes a tunable exploration parameter and a scalable way to predict performance for low-impression accommodations. Include considerations for cost, user experience, potential shift in advertiser clickshares, and how you would measure success in online A/B experiments.
Provide:
A detailed strategy for controlling how much to explore vs. exploit.
Specific steps for integrating exploration scores into the existing ranking pipeline.
Methods to handle large unexposed inventory without random cycling.
Ways to measure trade-offs between exploring new inventory and preserving topline metrics.
Detailed Solution
A core approach to this problem starts with modeling accommodation performance using a Beta-Binomial framework, then applying a mechanism to bias rankings toward unexplored or low-impression accommodations. The Beta-Binomial model captures the probability of a click given impressions, and it is updated with historical click/impression data. The posterior distribution emerges from a Beta prior combined with the Binomial likelihood.
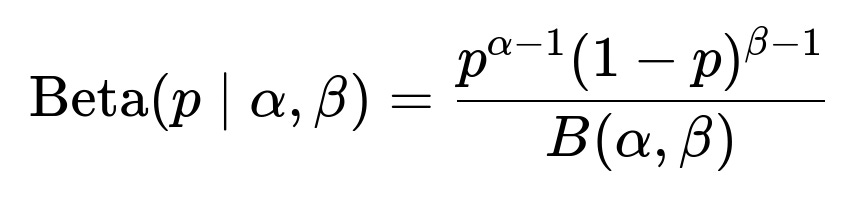
Here, p is the true but unknown click probability, alpha and beta are parameters shaped by observed clicks and non-clicks, and B(alpha,beta) is the Beta function for normalization.
Naive Exploration Adjustment
One early tactic is to replace the posterior mean with a more optimistic estimate. For each accommodation i, let mu_i be the posterior mean and sigma_i be the posterior standard deviation. A tunable parameter lambda (λ) adjusts the exploration strength:
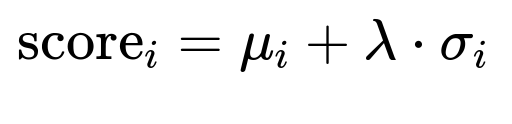
score_i is the new ranking feature. Accommodations with fewer impressions have higher uncertainty, so sigma_i tends to be larger, letting them rise in the rank. This is “naive” because it only uses impression-click counts.
Model-Based Approach
A more refined approach predicts an accommodation’s performance using additional features besides historical impressions. A predictive function f(item_features) is trained on high-impression items and used to infer potential quality for low-impression items. Items with strong predicted performance but minimal historical data receive higher rank to encourage exploration. This yields a smarter selection from the large unexplored pool.
Controlling Exploration Extent
Lambda steers the balance between known performers and unknown candidates. Higher lambda increases the clickshare of new accommodations but risks negative impacts on short-term revenue. Monitoring changes in user engagement and click distribution for different lambda values helps find a Pareto-optimal point where exploration is strong but performance remains acceptable.
Cost and Quality Assessment
Cost is measured by revenue or other topline metrics. Quality is measured by how newly exposed accommodations perform once they have impressions. Balancing these two involves testing multiple exploration intensities. Online A/B experiments measure:
Increase in clickshare from previously unseen inventory.
Performance of newly exposed items (conversion rates, clickthrough rates).
Impact on existing well-performing items and overall user satisfaction.
Implementation Details
A typical pipeline stores impressions and clicks over a recent period in a large-scale data processing environment (such as Spark). The pipeline:
Loads historical data.
Updates Beta-Binomial parameters or trains the predictive model.
Calculates a final exploration-adjusted score.
Ranks items by this score for real-time serving.
Computational costs come from frequent retraining or updating these scores. Monitoring dashboards track distribution shifts, new item performance, and user engagement trends.
Follow-up question 1: How would you handle extremely large pools of accommodations where most items have zero or near-zero impressions?
A model-based approach is essential. Generating features from property attributes (location, price range, brand, property type) offers signals for how an unexposed item might perform. Predictive modeling uses historical performance of similar high-impression items. Grouping accommodations by feature similarity can reduce dimensionality. Training data includes items with enough impressions to establish labels (click or conversion rates). This trained model estimates performance for new or sparse-data items. The system ranks these items according to the predicted score, increased by a calculated uncertainty term if needed. This avoids random cycling through all zero-impression items.
Follow-up question 2: How do you ensure no unfair bias toward a single advertiser or chain when you explore?
Impression share and clickshare per advertiser or chain is monitored by slicing A/B test metrics. If a certain advertiser or chain starts dominating impressions unnaturally, the system reevaluates features or constraints. Designing the exploration formula to avoid heavy weighting on brand-specific features helps maintain fairness. If a bias is detected, feature coefficients are adjusted or regularized in the model. Ensuring the exploration mechanism uses objective signals (historical performance plus predicted performance) and does not single out any advertiser is crucial.
Follow-up question 3: What if the model-based approach leads to negative exploration (fewer new items) despite the algorithm suggesting otherwise?
Unknown items might receive low predictions if the model is conservative or if the training set does not capture enough variety. Reviewing model inputs, calibrating outputs, and integrating an explicit exploration term (lambda * sigma) forces some exposure. Periodic manual or random checks can confirm whether enough new items appear in top ranks. Adjusting the training data window and verifying that the model’s loss function aligns with exploration goals also helps.
Follow-up question 4: How do you validate if your exploration mechanism is striking the right balance between user satisfaction and new inventory exposure?
Online A/B tests are conducted with different lambda settings. Compare user metrics (CTR, dwell time, conversion rates) and revenue metrics (generated bookings, advertiser returns). Observe changes in clickshare by old vs. new items, and watch for possible dips in short-term performance. Plot these metrics against exploration levels to identify the Pareto Front. The aggregator chooses a point that allows adequate discovery of new stock while preserving strong user outcomes.
Follow-up question 5: How would you scale this approach as new feature sets and more inventory become available?
The engineering infrastructure must support retraining or refreshing models in distributed environments (like Spark) at regular intervals. Efficient feature engineering pipelines handle missing values through imputation and normalization. Maintaining a robust data store that captures fresh impressions and clicks ensures timely updates of Beta-Binomial parameters or predictive models. Continuous integration practices automate versioning and testing of new features. Setting up dashboards for real-time monitoring of performance indicators ensures quick detection of drift or anomalies as the inventory expands.
Follow-up question 6: Why not just use a contextual multi-armed bandit algorithm in real time?
Contextual multi-armed bandits can be effective but may be computationally complex at the scale of thousands or millions of items. Real-time updating with high traffic demands efficient algorithms and infrastructure. The aggregator might balance the sophistication of a real-time bandit approach against engineering costs and user latency. A two-stage pipeline (precomputed exploration score plus real-time ranking adjustments) can be more practical. Whenever the system becomes able to handle real-time bandits at scale, it can transition or gradually incorporate them.
Follow-up question 7: How would you handle the cold-start problem for brand-new accommodations with no data?
Assign them a moderate prior in the Beta-Binomial model or compute a predicted score from static features (location, price, star rating, etc.). The naive term (mu + lambda*sigma) strongly favors items with fewer impressions if their features indicate reasonable potential. The model-based approach also checks how similar properties performed, giving new items an informed baseline. Occasional forced exposure through random or round-robin slots can guarantee that every item eventually gets some impressions, preventing indefinite exclusion from the ranking.
Follow-up question 8: If advertiser clickshares remain flat while new items get exposed, could that indicate missed opportunities for the advertiser?
The lack of change in advertiser shares might mean the exploration mechanism did not favor any particular advertiser or that the inventory is evenly distributed across multiple advertisers. Investigate if the advertiser is offering a range of new properties or if the exploration model is ignoring certain features. Encourage advertisers to provide better listing data to improve item features. Refine the weighting of model inputs so that new but high-potential properties from an advertiser do not get overshadowed by items with richer or older histories.
Follow-up question 9: How do you maintain model interpretability for business stakeholders who want clarity on ranking decisions?
Keep the Beta-Binomial posterior probabilities or model-based scores visible in analytics tools. Show how an item’s final score is derived from historical data plus the exploration term. Provide dashboards displaying user-level statistics (click probability, standard deviation, exploration factor). Offer partial dependency plots or feature importances if using advanced models. This clarity reassures stakeholders that the system balances new item promotion with performance accountability.
Follow-up question 10: How do you handle invalid clicks or fraudulent behavior that could skew the Beta-Binomial model or predictive model?
Implement click-fraud detection by filtering anomalies in click patterns or suspicious traffic. Adjust data pipelines to exclude these invalid clicks before updating the Beta-Binomial parameters. Retrain the model only on clean data. Ongoing checks for sudden changes in click/impression ratios across items can flag suspicious activity. This maintains the integrity of both exploitation and exploration performance estimates.