
ML Case-study Interview Question: Machine Learning & Phase-Split Modeling for Accurate Real-Time Food Delivery ETAs.


Browse all the ML Case-Studies here.
Case-Study question
A large food delivery platform processes millions of orders daily. The team wants to predict how long a food delivery will take from the moment a driver accepts an order until the food arrives at the customer's doorstep. The team notices that if predicted delivery times (ETAs) are too high, customers may not convert their sessions into orders, but if ETAs are too low, customers lose trust in the platform. The goal is to find a balanced, accurate, and real-time approach to estimate delivery times for each order, showing an ETA at different stages of the ordering funnel (discovery vs checkout). How would you design and implement a machine learning system to solve this problem, and what metrics and infrastructure would you use?
Detailed Solution
Problem Framing
The target is a numeric value representing the time from order creation until food arrives. It is approached as a regression task. Historical data shows the time it takes for different merchants to complete orders depends on features like merchant performance, food preparation time, order distance, and traffic conditions. A single merchant may have consistent patterns, but the number of merchants is large, and order-level features (distance, item types, order value) significantly impact predictions. Transforming each merchant’s past delivery patterns into features, then adding real-time order context, creates a comprehensive set of predictors for a regression model.
Modeling Approach
One method is to model the entire Actual Time Arrival (ATA) at once. Another method is to break down the ATA into three phases: T1 = time from booking to driver arriving at merchant, T2 = time from driver arrival to food pickup, T3 = time from pickup to delivery completion.
For each phase, train separate models. Summing these predictions gives the total ETA. For certain use cases, separate estimates for discovery vs checkout are helpful (because checkout can incorporate more real-time features like order value, route distance, and item count).
Error Metrics (Offline)
Regression error is measured by Root Mean Squared Error, Mean Absolute Error, and Mean Absolute Percentage Error. The core formulas:
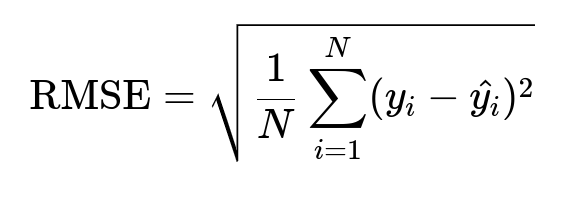
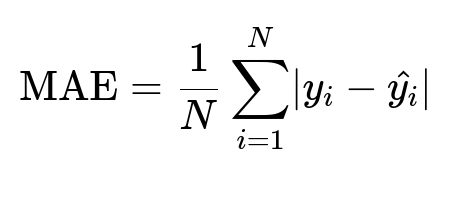
Here y_i is the actual arrival time of order i, and hat{y_i} is the predicted arrival time. N is the total number of orders. RMSE penalizes large errors more. MAE treats all errors equally. MAPE measures percentage deviation.
Online Metrics
Two key metrics in production: Compliance checks how often the real arrival time exceeds the predicted time. Too many underpredictions hurt user trust. Conversion measures how many sessions become successful orders. Overpredictions might drive anxious customers away, reducing conversions.
Baseline
A simple average of past delivery times yields high MAPE (~30%+). The new approach aims to lower error by incorporating detailed historical patterns and real-time features.
Model Features and Training
A popular approach uses XGBoost with several weeks of historical data. Merchant-level summaries are included (past median times, standard deviations, etc.) along with real-time features available at discovery and at checkout. Discovery relies on less granular information, so T1, T2, T3 for discovery can be computed in hourly or daily batch predictions. Checkout uses richer data (order value, exact route distance, etc.) in real time. The trained models reduce errors significantly, achieving MAPE near 23%.
Implementation Details
Hourly or daily batch jobs compute T1, T2, T3 for discovery. They store predictions keyed by merchant and time range in a fast data store. At checkout, a real-time scoring service fetches additional features (distance, basket size) and calls a prediction endpoint to compute T1, T2, T3 or a single wholesaler model’s output. An internal feature store provides up-to-date inputs, and a centralized model deployment tool serves inference requests.
Possible Improvements
Regular retraining with fresh data captures shifts in merchant performance and user behavior. Additional signals like restaurant busyness or local traffic can improve accuracy. Acceptance rate of orders by drivers can refine T1 predictions. More granular geographical features can refine T3 estimates in dense areas.
Potential Follow-Up Questions
How would you handle data sparsity for merchants with few orders?
Collect aggregated patterns across similar merchants (same cuisine type or location). Use hierarchical features like area-level statistics or category-level averages. Perform cold-start logic for new or rarely used merchants by applying aggregated group statistics until enough data is collected.
How do you select a final model between wholesaler vs phase-split approach?
Experiment offline using validation sets. Compare RMSE, MAE, and MAPE. Measure compliance and conversion with online experiments. A wholesaler model is simpler but might be less accurate because it ignores phase details. The phase-split model is more complex but often reduces errors if each stage’s behavior is distinct.
How do you ensure real-time inference with minimal latency?
Deploy the model behind a low-latency service. Cache static features. Use a feature store with efficient lookup. Pre-compute merchant-level aggregates at regular intervals. Ensure minimal network hops between the prediction service and the application server.
How do you handle outliers or extreme orders?
Use robust transformations of input features. Cap or clamp extremely large times in the training data. Introduce domain constraints to prevent nonsensical predictions. Evaluate outliers carefully to see if they are genuine or result from data inconsistencies.
How would you optimize compliance without harming conversion too much?
Monitor the balance between underprediction and overprediction. Introduce a penalty term for underprediction. Adjust final predictions slightly upward if compliance is failing. A real-time calibration approach can shift predictions by a small margin when recent arrivals deviate from forecasts.
What if merchants' speed or traffic patterns change suddenly?
Retrain regularly or perform online learning. Maintain a pipeline that ingests recent data into a rolling training window. If dramatic changes occur, trigger an ad hoc retraining job or override predictions with a short-term fallback model.
How do you handle partial orders with complex item combinations?
Estimate preparation time using item-level features. Aggregate complexities or sum up item-specific times, then add a context factor for concurrency in the kitchen. If order is large or has special items, increase T2 accordingly.
How do you validate the system post-deployment?
Compare predicted times with actual outcomes. Track MAPE, compliance, and user feedback. Run A/B tests to see if the new model version improves conversion and user satisfaction. Examine anomaly logs for large deviations.
There are many practical considerations, but combining historical merchant patterns with real-time features and separate phase modeling can greatly improve ETA predictions, reduce error, and maintain user trust.