
ML Case-study Interview Question: Estimating Lost Fulfillment Demand Using Conversion Probability Modeling

Browse all the ML Case-Studies here.
Case-Study question
The company operates a platform offering on-demand fulfillment services. Customers can choose from multiple delivery or pickup time windows. Due to events like traffic, bad weather, or staff unavailability, the service sometimes removes certain fulfillment options. If a customer’s preferred option is removed, they might choose not to place an order. This unobserved “lost demand” skews forecasts and leads to understaffing or oversupply in the long run. How would you build and validate a solution to model and estimate this lost demand so the platform can accurately forecast the total potential orders?
Describe your modeling approach, data features, and how you will handle unseen scenarios. Provide a detailed plan for measuring and validating your results. Also discuss any concerns about bias and feedback loops in your model and how you would mitigate them.
Detailed Solution
Overview of the Core Challenge
Customers who visit the platform but do not see their preferred fulfillment option might drop out. The primary complication is that this “lost demand” is not directly observable. If the platform offers fewer options, fewer orders are placed, creating a gap between actual orders and true potential demand.
Model Setup
One effective approach is to predict the probability of a customer order (conversion) given the available fulfillment options. The model needs to estimate the gap between observed orders and a counterfactual scenario where all options are available.
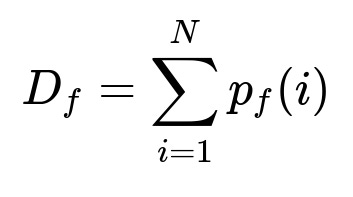
D_f is the total demand if all fulfillment options are available. N is the total number of customer visits. p_f(i) is the model’s estimate of the conversion probability for the i-th visit if all options are shown.
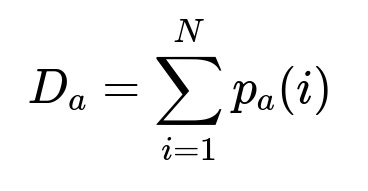
D_a is the total demand if only the actually offered options are shown. p_a(i) is the conversion probability for the i-th visit under the actual availability state.
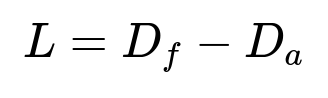
L represents total lost demand. By comparing D_f with D_a, the model infers how many orders were lost when certain options were hidden or removed.
Model Construction
Build a model that predicts conversion probability for each stage of the customer journey. The first model focuses on pre-checkout behavior. The second focuses on the checkout stage where purchase intent is higher. Each model will use features like past purchase frequency, session length, number of items searched, and which fulfillment options are visible.
For instance, a logistic regression model in Python might be structured as follows:
import pandas as pd
from sklearn.linear_model import LogisticRegression
from sklearn.model_selection import train_test_split

df = pd.read_csv("customer_sessions.csv")

X = df[["num_items_in_cart", "user_tenure", "preferred_option_visibility", "past_orders"]]
y = df["converted"]  # 1 if order was placed, 0 otherwise

X_train, X_test, y_train, y_test = train_test_split(X, y, test_size=0.2, random_state=42)
model = LogisticRegression()
model.fit(X_train, y_train)

y_pred_prob = model.predict_proba(X_test)[:, 1]
The first model can be built on visits at the pre-checkout stage. The second model can be built on visits where the user has reached checkout. Combining their outputs yields a robust estimate of total potential orders if all fulfillment windows were available.
Handling Feedback Loops
When lost demand is systematically underestimated, the platform will perpetually undersupply. Explicitly accounting for lost demand in the forecast avoids compounding errors. The model’s lost demand output corrects future supply planning by adding estimated unobserved orders.
Data Concerns
Visits with partial availability might appear similar to visits where the user is uninterested. This can blur the signal. Mitigate it with richer features (historical behavior, item searches, session durations). Also pay attention to correlation between limited availability and external events like holidays, storms, or local disruptions.
Offline Validation
Use historical data to compute AUC or log-loss on labeled sessions. Labeled outcomes are either “placed an order” or “did not.” Compare predicted probabilities with actual conversions. This helps refine the model hyperparameters.
Online Validation
Run controlled experiments where a small subset of users sees more time windows than usual. Measure actual conversion lift to gauge the difference between D_a and D_f. Adjust the model if estimates consistently deviate from real outcomes. Carefully manage the experiment to avoid overcommitment.
Practical Example
If 10,000 users visited, and your model estimates that with full availability, 8% would place an order (D_f = 800), but with observed availability, 6% placed an order (D_a = 600), then lost demand is 200. This suggests that removing certain windows cost you 200 potential orders.
What if the model is biased by external factors?
A model might overestimate lost demand if it ignores relevant variables like localized weather disruptions. It might underestimate if it does not capture occasional spikes in shopper availability. The best way to mitigate this is by continuously retraining with fresh data, adding region- or time-specific features, and cross-referencing estimates with actual order patterns during known events.
How do you ensure your solution scales to multiple markets and changing conditions?
Partition data by region. Train region-specific sub-models or incorporate region as a feature. Integrate dynamic pricing or resource allocation to adapt to changing supply and demand. Conduct A/B tests in a rolling fashion across different regions.
Could you refine the model if new fulfillment options are introduced?
Yes. Retrain or fine-tune the model with the updated set of options. Track each option’s influence on conversion at both pre-checkout and checkout. Option availability becomes an evolving feature, so frequent model refreshes or online learning methods can handle the changes.
How would you incorporate these estimates into a scheduling or resource allocation system?
Feed predicted lost demand into a workforce planning module. If lost demand is high in a time window, add more fulfillment capacity, or provide incentives for shopper availability. Adjust each window’s capacity dynamically based on forecasted traffic, weather, and user behavior data.
How do you prevent overcommitment when running experiments with full availability?
Use a fraction of the user base as a treatment group. Limit exposure so fulfillment resources can handle the additional orders. Monitor for negative impacts on service quality, such as delayed deliveries or cancellations.
How do you maintain strong stakeholder trust in these estimates?
Clearly communicate the uncertainty around lost demand. Present offline metrics like AUC and the results of online experiments. Provide confidence intervals and side-by-side comparisons of modeled vs. actual orders. Demonstrate consistency across different market segments over time.
What if the marketing team wants to see how promotional campaigns affect lost demand?
Include promotion indicators in the model. Track visits from promoted channels to see if they are more sensitive to changes in fulfillment availability. Validate whether lost demand differs significantly for promotional traffic vs. organic traffic.
How would you handle real-time updates to the availability data?
Collect availability signals continually. Use a near-real-time pipeline (for example, Spark Streaming or Kafka) to update your features. Recompute the probability of conversion at short intervals. Consider an approximate or incremental approach to keep computations feasible.
How do you justify building two separate models instead of one combined model?
Pre-checkout and checkout behaviors differ. Using separate models captures distinct user intentions and funnel stages. Each model can have specialized features and can be iterated independently, speeding up improvements and simplifying debugging.
How do you measure success?
Quantify how accurately the model predicts future orders in undersupplied scenarios. Observe if subsequent supply planning reduces lost demand over time. Use customer metrics such as fulfilled orders vs. forecasted potential, or improved reliability in delivering on promised windows.
How do you approach dynamic rebalancing of fulfillment options based on your model’s outputs?
Use a real-time dashboard to compare forecasted lost demand with actual orders in each region and time slot. If a slot is at risk of being undersupplied, dynamically reallocate staff or add incentives to cover that slot. Use a feedback mechanism that updates the model with the new supply allocation outcomes.
What about explainability?
For a random forest or gradient-boosted model, use feature importance to show which variables most influence predicted conversion. For logistic regression, interpret coefficients to understand how each feature (availability state, user history, location) affects the probability of conversion.
Could you integrate external data sources?
Yes. Pull in weather reports, local events, or holiday schedules to see if these disrupt staff or shift consumer behavior. Historical patterns of traffic or large local gatherings can be key features that refine lost demand estimates.
Why focus on lost demand rather than just observed demand?
Observed demand reflects only fulfilled orders. If supply is consistently too low, it artificially caps observed orders. Modeling lost demand uncovers the true potential, protecting the system from long-term underinvestment in resources.
How do you ensure the model’s predictions remain valid as consumer behavior evolves?
Automate frequent retraining with newly collected data. Run iterative experiments to detect drift in conversion patterns. Track error metrics or calibration metrics over time to confirm that the model’s outputs still align with ground truth observations.