
ML Case-study Interview Question: Predicting Home Buyer Intent: A Gradient Boosting Approach Using User Activity Data


Browse all the ML Case-Studies here.
Case-Study question
A large real-estate aggregator platform receives tens of millions of monthly visitors who exhibit diverse levels of interest in home-buying. Some users visit to track property values, while others actively pursue a purchase. The company wants to build and deploy a system to identify which users are most likely to close on a home in the near future.
Please outline your strategy for:
• Generating training labels that capture “high-intent” users, given that many transactions happen offline and only appear in public records weeks later. • Designing input features from user interactions onsite (e.g., viewing homes, saving homes) and offsite (e.g., emails, push notifications), along with user preference changes. • Selecting and training a machine learning model that can handle a massive, imbalanced dataset with tens of millions of users and thousands of possible features. • Dealing with partial coverage of the ground truth, since not all high-intent buyers can be positively matched to a transaction. • Deploying the model so that user scores can be used for targeted marketing and product personalization.
Detailed Solution
Data Labeling
Many high-intent actions (submitting an offer, completing a purchase) occur outside the platform. Publicly available home-sale records become accessible around 30–60 days post-closing. Matching these records to user accounts creates positive labels. Untagged users form the negative class, but they include many false negatives (actual future buyers who never matched). This labeling is noisy.
Feature Engineering
Logged user interactions on the site or app are aggregated into time-based signals. Recent activity counts (page views, saves, shares) and average session duration help quantify a user’s engagement. Offsite activity includes email openings, click-through behavior, and push notification interactions. User preferences (location, price range, property features) are tracked over time, focusing on how narrowed or broadened these preferences become.
Engineered features can easily reach 1,500 or more. Many are redundant or highly correlated (viewing for-sale listings correlates with saving those listings). Feature selection methods prune them down to about 50. Techniques include univariate filtering, correlation pruning, and randomized tree-based importance ranking.
Handling Class Imbalance
Most users labeled “negative” will not buy soon, so the dataset is extremely imbalanced. Downsampling the negative class during training improves the model’s ability to learn important patterns. This downsampling shifts predicted probabilities, so final scores need post-processing or be interpreted only for ranking purposes.
Model Training
A gradient boosting decision tree model (e.g., LightGBM) with hundreds or thousands of trees captures complex feature interactions. Trees learn splits that isolate behaviors indicative of imminent home purchase (increasing for-sale page views, higher dwell time, more property saves, narrowing location preferences). The model predicts a probability that a user is high-intent.
Partial Ground Truth
Many positive examples remain unlabeled because the matching is incomplete. An Area Under the Curve (AUC) metric can be misleading. Evaluating how well the model ranks known positives into top deciles is more insightful.
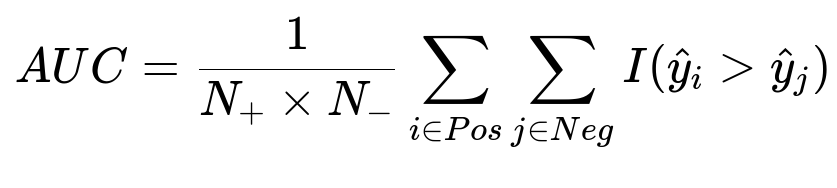
N_{+} is the number of actual positives, N_{-} is the number of actual negatives, and I(...) is an indicator function that is 1 if the predicted score for a positive sample exceeds that of a negative sample. Missing labeled positives reduce the reliability of any global metric. The practical check is whether top-scored users contain a much larger fraction of confirmed buyers than lower-scored groups.
Model Interpretability
Interpretable features are crucial. Commonly used explanations include feature importance rankings, partial dependence plots, or SHAP values for local decisions. Regulators might also require demonstrating that protected groups are not disproportionately adversely affected.
Deployment and Serving
A daily (or near-real-time) pipeline updates scores for users who have recent activity. These scores inform marketing campaigns, agent connect recommendations, or more personalized searches. The platform must respect user privacy choices for opting out from data usage.
Future Extensions
Segmenting users by real-time signals could trigger immediate personalization. Large LLM-based approaches may handle sparse or novel user sequences. Survival modeling could predict time-to-purchase. Ensemble methods might boost early detection of subtle intent signals.
How do you address follow-up questions?
How would you refine the model when many actual high-intent buyers remain unlabeled?
A two-pronged strategy. First, regularly update labels from public record transactions to eventually capture more positives. Second, treat negative labels as “not yet purchased.” Apply techniques like positive-unlabeled learning if feasible. Calibrate final scores by comparing distribution patterns of the known positives vs. all scored users.
How do you reduce the chance of overfitting to repetitive user actions?
Some user actions overlap heavily, such as repeated page views. Prune highly correlated features and consider aggregated frequencies that highlight emerging spikes or drops in activity. Use cross-validation to detect if the model overly relies on a small set of repetitive signals. Regularization in gradient boosting also mitigates overfitting.
How do you handle real-time scoring for sudden spikes in user intent?
Trigger incremental scoring in near-real-time pipelines. Track new session data or page visits in a streaming environment, compute the selected features incrementally, and push them into the trained model. Cache partial feature aggregates to avoid re-calculating from scratch.
How would you justify model decisions and ensure fair practices?
Share top feature influences for each prediction, confirm no legally protected attributes appear in the features, and run fairness checks against known demographic segments. Use interpretability techniques (tree SHAP) to show how each feature contributed to a user’s high-intent score.
What if performance metrics are still uncertain due to partial ground truth?
Monitor the fraction of known positives captured in higher deciles. Evaluate the model’s utility by measuring business outcomes (e.g., improvement in conversion from lead to closed deal). Track how well the model ranks newly discovered positives. Compare with holdout sets or external data sources where better labels might exist.