
ML Case-study Interview Question: End-to-End Machine Learning Pipeline for Predicting User Engagement and Activity

Browse all the ML Case-Studies here.
Case-Study question
A large online service platform noticed user engagement dropping on key product pages. They want a system to predict future user activity and tailor personalized recommendations to boost engagement and purchases. They have data streams from various touchpoints. How would you design an end-to-end machine learning pipeline to address this challenge, from data extraction to model deployment and performance monitoring?
Provide every technical detail on your approach, including data transformation, feature engineering, training, real-time inference, system reliability, and continuous improvement methodologies.
Detailed Solution
Design a multi-stage pipeline that can process user data, extract meaningful insights, train a predictive model, and integrate with the recommendation workflow. Emphasize data quality, scalability, and continuous feedback.
Data ingestion and processing
Ingest raw data from user clicks, dwell time, demographic information, transaction logs, and other interactions. Convert them into a standardized format. Use distributed data pipelines that can handle high throughput. Clean missing values. For time-sensitive features, sort data chronologically and unify it by consistent user identifiers.
Feature engineering
Represent user behavior by aggregating session features. Include historical engagement metrics, device attributes, session duration, purchase count, and item categories viewed. Create time-lagged features capturing recency and frequency. Convert categorical fields to numerical encodings. Ensure transformations remain consistent in production.
Model selection
Train regression or classification models, depending on whether you predict engagement probability or future revenue. When dealing with a binary engagement indicator, logistic regression is common. For large-scale data, gradient-boosted trees or deep neural networks often yield higher accuracy if you have enough training samples. Employ cross-validation for hyperparameter tuning.
Example logistic regression math
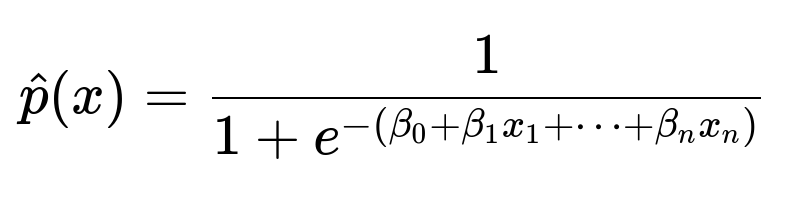
Here, beta_{0} is the intercept, beta_{1}, beta_{2}, ..., beta_{n} are the feature coefficients, x_{1}, x_{2}, ..., x_{n} are the processed features, and the function estimates the probability of user engagement given the input features.
Training and evaluation
Use historical data to split into training and validation sets by date ranges. Evaluate models with metrics like precision, recall, AUC, or RMSE (if predicting a numeric target). Monitor overfitting. Use scaling for large features. Regularize if necessary.
System deployment
Serve the final model behind an API. Store the trained model artifact in a version-controlled registry. Integrate feature transformations as micro-services. For real-time inference, expose endpoints that receive feature vectors and return engagement probability or recommended product IDs. Provide caching or streaming for high-volume requests.
Monitoring and iteration
Track prediction accuracy, user acceptance, and throughput at inference. Retrain periodically if data distribution shifts. Automate retraining triggers by analyzing data drift or dropping performance. Log user feedback into an analytics store for continuous improvement.
Example code snippet (training a simple logistic regression)
import pandas as pd
from sklearn.linear_model import LogisticRegression
from sklearn.model_selection import train_test_split
from sklearn.metrics import roc_auc_score

# Suppose df is our feature DataFrame with label column
X = df.drop('label', axis=1)
y = df['label']

X_train, X_val, y_train, y_val = train_test_split(X, y, test_size=0.2, shuffle=False)

model = LogisticRegression()
model.fit(X_train, y_train)
pred_probs = model.predict_proba(X_val)[:,1]
auc_score = roc_auc_score(y_val, pred_probs)
print("Validation AUC:", auc_score)
Train a more advanced model if data is large or non-linear. Implement robust testing and resilience checks. Document the pipeline with flow diagrams and accessible notebooks.
What if the model performance drops after deployment?
Continuous monitoring is mandatory. Implement automated checks on data distributions. Compare incoming data statistics with training data. If you see feature drift, trigger a retraining job. Log real outcomes and use a new label to measure real-world performance. Introduce more features (such as changing user behavior signals). Evaluate potential external influences like seasonality or user-interface redesign.
How do you handle large-scale data and real-time latency constraints?
Partition data and process in parallel. Employ a scalable storage engine. Use distributed computing for feature extraction. For inference speed, serve precomputed features or cache partial computations. Consider a streaming architecture that updates user features on every interaction. Use GPU or specialized hardware if model inference is computationally heavy.
How would you ensure the system remains reliable and fault-tolerant?
Containerize your services. Deploy them with orchestration tools that can auto-restart on failure. Isolate each stage: data ingestion, feature store, inference API, and model repository. Log events and errors in a central store. Set up alerting for anomalies in throughput or latency. Maintain rollback pipelines in case a model release causes performance degradation.
How do you manage the trade-off between explainability and performance?
Test simpler models that can be explained (like linear or tree-based methods with interpretability modules) versus higher-performance neural models. If regulations or business needs require more interpretability, produce feature-importance metrics or local explanations for key predictions. If performance metrics far outweigh interpretability, proceed with more complex ensembles, but still store logs for post-hoc analysis when needed.
How would you include time decay or recency effects in modeling user engagement?
Weight recent interactions more heavily. For example, you can generate features that discount older sessions. Maintain rolling averages and moving windows. Let the model interpret how quickly user behavior changes. In training, ensure that older data does not overshadow fresh data. Pipeline transformations can embed time-lag features by offsetting the time window.
How do you handle high class imbalance?
Use data-level approaches like undersampling or oversampling. Experiment with synthetic data (like SMOTE). Use algorithm-level approaches by adjusting class weights or focusing on relevant metrics. Calibrate the probability threshold that defines a positive prediction. Evaluate recall or precision at top-k predictions if the business objective is to target a limited subset of users.
How do you ensure the system remains flexible to future enhancements?
Refactor data pipelines into modular stages that can be replaced without rebuilding the entire system. Use feature stores to keep transformations consistent. Keep environment details in configuration files. Write integration tests that cover each stage. Store historical models in a registry so you can revert or compare new approaches easily.
These approaches combine practical engineering, algorithmic rigor, and continuous iteration. They address data readiness, architecture design, model reliability, and business alignment.