
ML Case-study Interview Question: Predicting Carpool Detour Acceptance Using Gradient Boosting Models


Case-Study question
A carpooling platform connects drivers offering seats with passengers seeking rides. Drivers often publish only a broad start and end point, and the platform expands these listings with possible detours, called "Boost rides." These extra rides help passengers in smaller locations connect with passing drivers, increasing chances of a successful match. However, many drivers reject the detour requests because they find them inconvenient, causing passenger frustration.
You are tasked with building a machine learning system that predicts whether a driver will accept or reject a "Boost ride." You must use the predicted acceptance probability to decide whether to show the detour to potential passengers, balancing the need to display enough results without showing too many unwanted rides. You must handle large-scale data, serve predictions in real time, and continually refine the model as user behavior changes.
Propose a complete solution, including how you would gather training data, define features, choose models, set thresholds, update models, monitor performance, and ensure your approach maximizes the overall number of matched rides. Explain your reasoning step by step, and discuss how you would test and iterate on the system.
Detailed solution
Data collection and definition
Historical data is the foundation. Each row represents a past "Boost ride" request. The features include driver attributes (driver location history, acceptance history, time since they joined), ride-specific details (distance, requested detour, day and time, how much time until departure), and passenger demand in that area. The label is whether the driver accepted or rejected the request. Gather this data from server logs or a rides database, ensuring each request and corresponding outcome is recorded.
Feature engineering
Combine temporal features, such as day of the week or hour, with route features, such as driver’s main route length or typical detour tolerance. Include driver-level features capturing historical acceptance rates for similar detours. Incorporate one-hot or embedding-based representations for relevant locations. The goal is to capture the context in which drivers usually accept or reject detours.
Model choice
A gradient boosting model, like XGBoost, is often suitable for large-scale tabular data with complex interactions. It can handle numerical and categorical features and deliver accurate real-time predictions. A logistic regression model can also work if data is high-dimensional and you need interpretability, but gradient boosting typically yields better performance for structured data at scale.
Below is a core classification formula illustrating the logistic function used inside many methods, including gradient boosting when dealing with logistic loss:
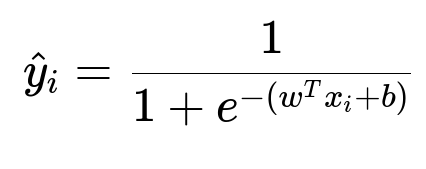
Here, x_i is the feature vector for the i-th request. w is the weight vector learned by the model. b is the bias term. The output is the predicted acceptance probability.
Setting thresholds
Use acceptance probability to decide whether to show the Boost ride. A higher threshold restricts the search results to rides that drivers are very likely to accept, which raises acceptance rates but risks hiding rides that could still lead to successful matches. A lower threshold broadens available options but risks more rejections. Conduct offline experiments or A/B tests to find a threshold that optimizes the trade-off between acceptance rate and total matches.
Real-time serving
When a passenger searches for rides, generate potential "Boost rides" by identifying feasible detours. For each detour, compute the acceptance probability using the model. Filter out detours below the threshold. Return the remaining options to the passenger instantly. Ensure the system is low-latency by deploying a well-optimized prediction service (for example, a model served by a dedicated prediction engine or via a microservice architecture).
Updating the model
Retrain periodically to adapt to changes in driver behavior. Monitor data distribution. If drivers begin rejecting or accepting more often because of external factors such as gas prices or new regulations, the model might lose accuracy. Use an automated pipeline that regularly refreshes training data, runs validation, and pushes new models if metrics improve.
Monitoring success
Track acceptance rate, total ride matches, passenger retention, and driver satisfaction. If acceptance rate or total matches dip, investigate data shifts or threshold settings. Perform A/B tests on subsets of traffic to confirm that changes to thresholds or model upgrades genuinely improve metrics.
Maintaining user experience
Fewer rejections improve driver satisfaction. Passengers benefit from seeing rides they can reliably book. Continually refine the feature set and threshold strategy to keep both sides engaged.
How would you handle new drivers with limited data?
A new driver who never accepted Boost rides has no direct acceptance history, so the model might be less accurate for them. Use general population statistics for default values or a separate model for cold-start drivers. Gradually merge them into the main model as soon as there is enough data. Another strategy is to cluster driver profiles, then assign the new driver to the closest cluster, inferring acceptance behavior from drivers with similar traits.
How would you deal with data drift?
Shifts in travel habits, seasonal changes, or new road regulations can cause driver preferences to evolve. Monitor model metrics and data distributions. Track how the distribution of request distances or trip times changes over months. If there is a major divergence, trigger an investigation or a scheduled retraining. For instance, if a new policy influences working hours, more drivers might reject evening detours. Regularly check acceptance patterns to detect such shifts.
How would you optimize for real-time predictions at scale?
Keep the feature extraction pipeline efficient. Cache precomputed driver behavior features (like average acceptance rate for detours), and maintain a fast store for geographical and time-based data. Deploy the model behind a high-throughput inference service (for example, a REST endpoint with an optimized runtime). Ensure horizontal scalability with load balancers, so the system can handle many concurrent passenger searches.
How would you test threshold selection in production?
Use an A/B testing framework. Split users into groups. Serve each group with a different threshold. Compare acceptance rates, total bookings, and user satisfaction across groups. If one threshold significantly outperforms the others, adopt it as the default. Periodically re-run tests to verify ongoing effectiveness, because optimal thresholds can drift over time.
How would you handle explainability and trust?
Provide drivers with concise messages about the nature of the detour. For instance, communicate approximate extra time involved. Explain to product managers how the model uses distance or driver acceptance history. For sensitive use cases, add a simple rule-based fallback or an interpretable sub-model. This fosters transparency and trust without overloading users with technical details.
How would you improve the system further?
Refine geospatial intelligence by snapping driver routes to known road networks. Investigate deeper neural architectures that capture more complex interactions or personal preferences. Explore sequence modeling for drivers with repeated patterns over time. Iterate on user interface design to help drivers quickly decide if a detour is suitable. Collaborate with product teams to run more tests on how newly presented rides affect acceptance, marketplace health, and user retention.
The overall system should create relevant, high-quality matches that maximize acceptance rates and passenger satisfaction. The key is iterating on data quality, model accuracy, real-time performance, threshold tuning, and user experience to ensure the platform thrives.