
ML Case-study Interview Question: Scalable Time-Series Forecasting for Multi-Region Food Order Demand


Browse all the ML Case-Studies here.
Case-Study question
You are given time-series data reflecting how many food orders were placed in multiple regions at a large-scale online food ordering platform. Each region has different behavior. The goal is to build a reliable Order Volume Forecasting system that predicts daily or half-hourly demand. You have access to years of historical order data, weather information, holidays, and other features. Provide your end-to-end solution approach. Propose how to handle the data, the most suitable models, and how you would evaluate and improve your forecasts. Clarify your reasoning, how you would address edge cases, and how your approach can be scaled to serve hundreds of regions with diverse order behavior.
Detailed Solution Explanation
Historical order volume for each region forms a time-series that is not IID (independently and identically distributed). Dependence across consecutive timestamps must be modeled. This means we cannot shuffle data randomly for model training and validation. We instead use backtesting. We train models on the data up to a certain point and predict a future horizon that is already in our labeled dataset. We then compare forecasts with real future values.
Handling the Data
Data includes timestamps, holiday flags, weather measurements (temperature, rainfall, snowfall), region identifiers, and historical orders. We divide each region’s timeline into training periods and testing periods. We ensure that any predictor used (like temperature on a future date) is also available at inference time, often by using weather forecasts or known holiday dates. Each region’s data can be extensive or sparse. Some regions might only have a few months of historical data, which requires a robust approach.
Modeling Approach
Some models rely on autoregression, which means using recent actual values of the time-series as predictors. For instance, one simple autoregressive formulation is shown below.
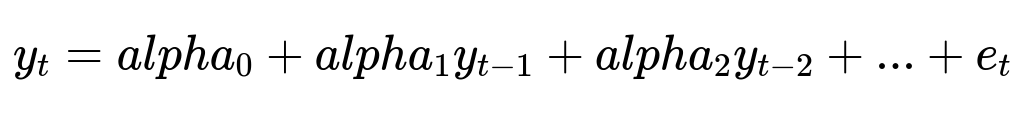
Here, y_{t} is the target at time t, alpha_0 is a constant intercept, alpha_1 through alpha_2 are model coefficients, and e_{t} is the error term. Autoregression quickly adapts to changing trends since it leverages the most recent data points.
Time-indexed predictors capture cyclical or seasonal patterns. For example, day-of-week variables, holiday indicators, or long-term sinusoidal effects (like higher orders in winter). We can combine both autoregressive terms and time-indexed variables within advanced models (e.g., ARIMA, Prophet, DeepAR, or Transformer-based approaches). We can do local models per region or a global model that ingests data from all regions. Global models learn broad behaviors but must still adapt to individual region differences.
Training and Backtesting
We conduct rolling backtests by iterating through different cutoff points in the history. Each time, we train the model up to that cutoff and predict forward (say, 14 days). We then check metrics like RMSE or MAE. A plain text version of Mean Squared Error:

Where y_i is the actual value and yhat_i is the predicted value. We use these metrics to compare multiple candidate models.
Ensembling
We often build several models (like a local ARIMA, a global neural network, a simple rolling average, or a gradient boosting regressor). We then combine their forecasts for each region through an ensemble method such as taking the median or a weighted average. This is a strong defense against single-model failures and typically improves accuracy.
Robustness and Backup
If a key feature (like weather) becomes unavailable or if there is a dramatic market shift (like a sudden policy change), simpler models (like a naive repeat-of-last-week’s-volume) can act as backups. We compare each new approach to such a baseline. If it fails to outperform the baseline, we discard it.
Implementation Details
A typical solution pipeline:
Load region-level historical orders.
Merge with holiday and weather data.
Create training sets with the appropriate historical window.
Train a combination of models with autoregressive and time-indexed features.
Perform rolling backtests to tune hyperparameters.
Generate predictions for the next horizon.
Ensemble the predictions.
Send the final forecast to the scheduling system or the application that needs it.
Scalability
We must automate data ingestion, feature engineering, training, and prediction generation. A pipeline orchestrator (like Airflow or a similar workflow tool) can schedule nightly runs of the forecasting system. We store final predictions in a database for consumption by downstream applications. This ensures hundreds of region-forecasts can be produced and updated regularly.
What Would Be Your Follow-Up Questions?
1) Could you describe how you would handle seasonality across different regions with different seasonal patterns?
Seasonality is highly variable. We can incorporate day-of-week patterns, monthly trends, or holiday surges using time-indexed features and by letting the model learn from enough history. For regions with inconsistent data, we use a global approach or shrinkage/regularization so the model borrows information from other regions with similar seasonality. An alternative is to cluster regions by common behaviors and apply a more specialized local approach within each cluster. Models like SARIMAX or neural networks with learned seasonal embeddings can track complex patterns across multiple seasonal frequencies.
2) How would you adapt your model during unprecedented shocks, such as a sudden lockdown or a global event?
We retrain the model frequently and rely on more autoregressive signals to quickly adjust. We might keep separate model variants for pre- and post-event data if the event significantly alters consumer patterns. We re-weight or remove older historical data that is no longer relevant. If a certain region experiences drastically changed conditions, local model retraining is triggered more often. We also maintain a backup naive approach in case advanced models degrade due to never-before-seen distribution shifts.
3) Could you show how to implement a simple baseline in Python and explain its components?
A simple baseline might be “next day’s forecast = average of the same weekday from the previous four weeks.” In Python:
import pandas as pd
import numpy as np

# df has columns: ['date', 'region', 'orders']
# Assume daily aggregation per region.

def baseline_forecast(df, forecast_date):
    # Filter data 4 weeks prior
    start_date = forecast_date - pd.Timedelta(weeks=4)
    mask = (df['date'] >= start_date) & (df['date'] < forecast_date)

    historical_data = df.loc[mask]

    # Suppose we only forecast 1 day ahead
    # We'll average daily orders, but we can refine to same weekday
    mean_orders = historical_data['orders'].mean()
    return mean_orders
We read the historical data up to the desired point, compute the average of the last four weeks of that region, and output that as the forecast. If the region typically has strong day-of-week patterns, we refine to average only that matching weekday. This approach has minimal overhead but can perform surprisingly well.
4) Why might you prefer a global model over many local models?
A global model can learn generalized patterns from multiple regions that share similar dynamics (like holiday dips or promotional spikes). It can handle new regions with sparse data by leveraging overall learned structure. Local models do well when each region is highly unique and has enough data. However, local models might not generalize well to new or fast-evolving regions. Global models also simplify code maintenance, as we have a single pipeline instead of hundreds of region-specific trainings.
5) How would you combine these models into an ensemble, and why?
We calculate each model’s output (e.g., LSTM-based forecast, ARIMA-based forecast, naive baseline). We store them in a single table keyed by date and region. Then we compute a final forecast by taking the median or a weighted average. The weighting can be uniform or based on each model’s historical accuracy. This merges diverse modeling ideas and reduces the risk of a single model’s systematic bias.
6) How would you measure success and confirm the model’s business impact?
We pick one or more error metrics like MSE, RMSE, or MAE. We monitor these metrics on a validation set via rolling backtests. If forecasts match actual orders closely, that indicates success. Operationally, better forecasts mean fewer missed deliveries or idle drivers. We track how often driver capacity meets demand without causing delays. If the model’s accuracy improvement cuts down late deliveries or excessive staffing, it demonstrates real-world impact.
7) Could you discuss how you would productionize and maintain this forecasting system?
We build an automated pipeline that performs data extraction, feature computation, training, and inference regularly. Workflow management ensures daily or weekly re-training, depending on data velocity. A version control system tracks model configurations. We store forecasts in a central repository accessible to scheduling or dispatch systems. We set alerts if data anomalies occur or if a model’s performance drifts. We incorporate continuous integration and testing to ensure the entire pipeline runs reliably at scale.