
ML Case-study Interview Question: Bayesian Root Cause Analysis for Real-Time ML-Detected Microservice Anomalies


Case-Study question
A large digital banking enterprise has a highly interconnected set of microservices that handle critical customer transactions. When a component within the technology stack fails or slows down, the disruption cascades, causing customer-facing features to break. The enterprise has many disparate monitoring tools producing siloed data from networks, APIs, databases, and infrastructure logs. They must process terabytes of data in real time, detect anomalies, identify the root cause quickly, and remediate the issue. As a Senior Data Scientist, design a machine learning system that automates the detection, diagnosis, and remediation of app failures. Propose an architecture for real-time data ingestion, anomaly detection, root cause analysis, and actionable alerts that inform the correct team about the failing microservice.
Detailed solution explanation
Modern applications produce large volumes of metrics, logs, and user interaction events. Manual triaging of these data sources is slow. Machine Learning can automate anomaly detection and root cause analysis in near real time, accelerating issue resolution.
Real-time ingestion and integration
Engineers set up pipelines that stream data from infrastructure monitors (CPU, memory, and disk usage), application logs (request volumes and HTTP error codes), and network metrics (latency and throughput). These streams are routed to a framework such as Apache Kafka. A specialized microservice consumes these streams, normalizes the records, and attaches metadata like timestamps or application-region labels.
Time-series anomaly detection
Each key metric is modeled as a time series. The system inspects recent values of request volume, error count, or response latency. A time-series anomaly detection model (for example, an autoregressive or hybrid statistical approach) flags unusual patterns. If a microservice's request error rate abruptly spikes, the model produces an anomaly signal. Another model might watch latency. If it increases rapidly for a short period, another anomaly signal is triggered.
Causal inference with Bayesian Networks
Anomalies often appear across many components. A Bayesian Network can produce a directed graph of dependencies and compute the likelihood that a specific service is the root cause. Suppose we have components X_1, X_2, ..., X_n, each with parent nodes describing which services or infrastructure layers feed into them.
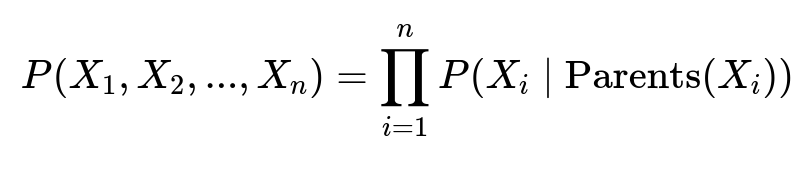
Each X_i represents the operational state of a component (healthy or failing). Parents(X_i) are the services on which X_i depends. This formula shows that the joint probability of the entire network factorizes into each node’s conditional probability given its parents. We compute the probability that a particular component is the primary cause by observing which node’s failure state can best explain the anomaly distribution across the graph.
Parameters:
X_iis the binary or categorical state of the i-th component (for example, healthy = 0, anomalous = 1).Parents(X_i)are the set of components directly feeding or affecting X_i.P(X_i | Parents(X_i))is the conditional probability that component X_i fails given the states of the components on which it depends.
Actionable alerts and remediation
The system must send automated alerts to the right teams via existing on-call channels. Each alert includes:
A direct pointer to the suspected root-cause microservice.
An explanation of why the model believes this is the source (for example, a spike in error rate or an outlier in latency patterns).
A visual dependency graph showing the impacted microservices and their status.
When repeated incidents have a known fix, an automated remediation script can run. For example, if the root cause is a misconfigured load balancer, an automated script can revert to the last known stable configuration. If the issue is an exhausted database connection pool, an auto-scaling command can be triggered.
Sample Python snippet
Below is an example of how a time-series anomaly detection pipeline might be structured:
import numpy as np
import pandas as pd
from statsmodels.tsa.seasonal import STL

def detect_anomaly(time_series_data):
    data_series = pd.Series(time_series_data)
    stl = STL(data_series, period=1440)  # assuming daily pattern of 1440 mins
    result = stl.fit()
    residual = result.resid
    mean_resid = np.mean(residual)
    std_resid = np.std(residual)
    threshold = 3.0
    anomalies = []
    for idx, val in enumerate(residual):
        if abs(val - mean_resid) > threshold * std_resid:
            anomalies.append(idx)
    return anomalies
This uses a seasonal-trend decomposition method to detect anomalies. In practice, many advanced approaches exist, but the core idea remains to highlight out-of-bound behaviors in real time.
Potential follow-up questions to probe deeper understanding
1) How do you ensure the model adapts to changing user behavior or seasonality?
Retrain or fine-tune the models with recent data. Incorporate rolling windows for training. Implement drift detection. Reassess seasonality parameters if user traffic patterns shift (for example, holiday spikes).
2) How do you handle false positives in anomaly alerts?
Evaluate the predicted alerts against known labels or historical alerts. Adjust anomaly thresholds or experiment with ensemble methods. Use domain knowledge to refine the Bayesian priors and dependency structures.
3) How do you ensure high availability of the ML pipeline itself?
Use a fault-tolerant distributed compute platform, replicate streaming consumers across availability zones, and containerize the ML services for quick failover. Store critical data in multiple regions and implement a robust CI/CD pipeline.
4) How do you secure sensitive logs and data?
Scrub or mask personally identifiable information before ingestion. Enforce strict role-based access controls for the pipeline. Encrypt data in transit using Transport Layer Security. Regularly audit logs for unauthorized access.
5) How would you move from automated detection to fully automated remediation?
Build a database of historical remediations for specific component failures. Develop scripts to apply corrective steps. Extend the pipeline to trigger these scripts based on high-confidence root-cause predictions. Test carefully to avoid unintended consequences.
6) What if multiple root causes exist at once?
Allow the Bayesian Network to produce probabilities for multiple nodes. Rank the most likely root causes. Alert on the highest combined probability or route each possible cause to relevant teams for parallel checks.
7) How do you evaluate the performance of this system?
Track metrics such as mean time to detect, mean time to repair, and false alarm rate. Compare those metrics with historical baselines. Conduct post-incident reviews to see if the system identified the correct root cause.
8) How do you maintain the Bayesian Network as services evolve?
Establish an automated approach to keep the dependency graph updated. If new microservices are introduced or dependencies change, generate a new adjacency list. Revalidate conditional probability tables periodically.
9) How do you handle incomplete or noisy data from certain logs or metrics?
Use imputation or smoothing techniques. Flag data sources as unreliable if too many records are missing. Incorporate domain logic to skip or lower the weight of those sources in the Bayesian inference step.
10) How can you measure the business impact and justify further investment in the system?
Record the reduction in downtime and incident handling hours. Calculate monetary savings or user retention improvements from faster resolution. Present these metrics to leadership for continued support and resource allocation.
This end-to-end solution improves reliability of critical digital products by transforming fragmented monitoring data into high-confidence anomaly detection and root cause insights. The automated alerts and scripted fixes greatly reduce the time to restore service.