
ML Case-study Interview Question: Mitigating Bias in Real Estate Text using Topic Modeling and Fair Machine Learning.


Browse all the ML Case-Studies here.
Case-Study question
A real-estate technology company collected extensive data on property listings, focusing on textual descriptions, numerical attributes like property price, and other information about each home. They discovered that some neighborhoods have majority non-Hispanic white demographics (Group A), and others have majority Black demographics (Group B). Homes in Group A often have higher prices and more luxurious features, while homes in Group B often have characteristics appealing to investors and first-time buyers. The company wants to build AI-powered recommendations and pricing models using listing descriptions, but they worry the textual data might act as a proxy for protected attributes (like race).
They ask you to propose how you would analyze these listing descriptions, detect any disparities or biases, and then design a machine learning pipeline that leverages this text safely. They want to see if there are major semantic differences in listings between Group A and Group B, how these differences correlate with protected attributes, and how you would mitigate the risk of biased downstream predictions or recommendations.
Provide an end-to-end solution plan for how to approach this problem, explain your reasoning in detail, and show how you would verify that the final model meets fairness requirements.
In-depth Solution
Data Collection and Basic Exploration
Group all real-estate listings by their location and label each listing using the dominant racial demographic of the neighborhood. Split the data into Group A (majority non-Hispanic white) and Group B (majority Black). Compile key attributes for each listing, such as price, square footage, number of photos, and textual length of listing descriptions. Notice correlations, especially how Group A listings might be longer or more focused on upscale features, and Group B listings might be shorter or more focused on investment-oriented topics.
Simple Statistical Comparisons
Compare how many words (tokens) appear in listing descriptions for each group. Examine correlations between token counts, price, and other features. Higher prices in Group A can correlate with more features to describe, leading to longer text. This indicates that textual length alone can correlate with demographics, highlighting how text can become a proxy for protected attributes.
Key-Phrase Extraction and Odds Ratios
Extract common phrases from each listing using a simple approach: split each description into trigrams (e.g., "pool and spa", "to your portfolio"). Compute the relative frequency of each trigram in Group A vs Group B. A key technique is the odds ratio:
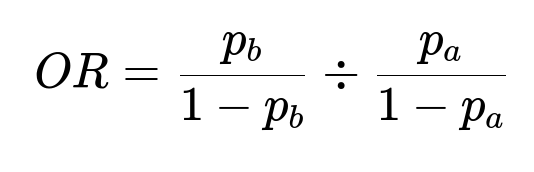
Here p_b is the probability of a phrase in Group B, and p_a is the probability in Group A. A value of OR > 1 implies the phrase is more common in Group B. Large values of OR can show distinctive phrases in Group B such as "to your portfolio," whereas values < 1 can show distinctive phrases in Group A such as "pool and spa." This step proves the content of the listing descriptions indeed varies by neighborhood demographics.
Topic Modeling
Use Latent Dirichlet Allocation (LDA) to cluster semantically related text. Train one topic model on a representative sample of listings from both groups. Extract multiple topics and examine which ones appear more often in each group. Assign short descriptive labels to each topic using a large language model prompt based on the highest-frequency words in that topic. Notice patterns such as "Luxury amenities" dominating Group A and "Investor-friendly features" dominating Group B. This cements the conclusion that listing descriptions can encode signals about protected attributes.
Model-Building with Fairness in Mind
Design a pipeline that uses the text in a controlled manner. Consider removing or masking phrases strongly correlated with race or location-based information that might create disparate impact. Explore adversarial debiasing methods, where a secondary model tries to predict a protected attribute from the main model’s hidden representations, and the main model’s training objective penalizes any successful prediction of that attribute.
Consider a fairness-aware loss function or post-processing constraints. Monitor outputs for disparate predictions across demographic groups. If building a pricing estimate, check whether the model systematically inflates or deflates predicted prices based on textual cues correlated with demographics. Calibrate the model so it relies on genuine property features rather than signals reflecting protected attributes.
Validation and Monitoring
Evaluate the model’s outputs across groups. Check if the model’s errors or performance metrics differ significantly for listings in Group A vs Group B. Use fairness metrics (for instance, differences in Mean Squared Error or average predicted price across protected groups). Confirm that removing or penalizing sensitive textual features reduces disparities without harming overall performance significantly. Implement continuous monitoring to detect drift, especially as new listings flow in.
Practical Python Implementation Overview
You could preprocess text with a library like spaCy or NLTK to generate tokens and trigrams. Compute frequencies and the odds ratio using standard Python libraries (Pandas, NumPy). For LDA, libraries like gensim or scikit-learn can be used. A snippet to compute text frequencies:
import pandas as pd
from collections import Counter

# df has columns: 'description' and 'group'
group_a_text = df[df['group'] == 'A']['description']
group_b_text = df[df['group'] == 'B']['description']

def get_trigrams(text):
    tokens = text.lower().split()
    return list(zip(tokens, tokens[1:], tokens[2:]))

group_a_trigrams = Counter()
for desc in group_a_text:
    group_a_trigrams.update(get_trigrams(desc))

group_b_trigrams = Counter()
for desc in group_b_text:
    group_b_trigrams.update(get_trigrams(desc))

# Then compute odds ratios across top trigrams
For LDA:
from sklearn.feature_extraction.text import CountVectorizer
from sklearn.decomposition import LatentDirichletAllocation

vectorizer = CountVectorizer(stop_words='english', max_features=50000)
X_a = vectorizer.fit_transform(group_a_text)
X_b = vectorizer.transform(group_b_text) # ensure consistent vocabulary

# Combine if you want a joint model
X_combined = ...
lda = LatentDirichletAllocation(n_components=15, random_state=42)
lda.fit(X_combined)
This approach reveals the distribution of topics in each group. Then interpret or label each topic.
Fairness Impact
Implement a final check to ensure minimal correlations between your model’s predictions and protected attributes. If correlations remain high, incorporate methods like domain adversarial training or rewrite the text embeddings. Log those metrics in an ongoing manner to catch biases in production.
Possible Follow-up Questions
How would you address the possibility that a simpler numeric feature (like home price) might be the real driver of bias, rather than the text?
Work with domain experts to measure how strongly home price alone correlates with protected attributes. Compare the downstream model’s performance and fairness outcomes when training with and without text. If bias persists even without the text, the price feature might be the main concern. If removing text significantly reduces disparities, the text is likely amplifying protected signals. Use standard correlation or mutual information approaches to confirm how text-based features interact with price.
How would you handle out-of-distribution cases, where text might use unusual language or brand-new terms not found in training data?
Monitor perplexity or other LLM-based scoring methods to flag novel phrases. Retrain or fine-tune your embeddings periodically. If the pipeline is static, new terms might be ignored, skewing the model. Incorporate user feedback loops to identify new patterns. Maintain an updated vocabulary or continuous embedding pipeline to avoid distributional shifts that degrade performance or resurrect biases.
Why not remove text altogether to eliminate textual bias?
Removing text discards potentially important signals like home improvements or descriptive features that can improve user experience or price estimates. The real solution is to regulate or transform text-based signals to reduce correlation with protected attributes. If text features are significantly boosting accuracy, discarding them might be suboptimal.
How do you ensure compliance with legal requirements such as Fair Housing regulations?
Collaborate with legal teams that understand relevant regulations around credit, lending, and housing. Document each step to confirm the model does not exclude or penalize properties in protected areas. Conduct fairness tests before deployment. If laws require that certain protected attributes never factor into a decision, apply dimension reduction or adversarial training to ensure minimal correlation. Maintain thorough logs of your fairness audits.
Why use a topic model instead of just word-level frequencies for bias detection?
Word-level frequencies do not reveal broader semantic context. Topic models cluster words into themes that capture more general patterns. This approach shows how entire concepts or messages differ across demographic groups. A single word can appear in various contexts, so looking at topics helps identify more systematic and hidden differences that might be overlooked by raw frequency checks.
How do you prevent the pipeline from drifting back into biased territory after deployment?
Set up periodic reviews of model outputs, especially around fairness metrics. Retrain with fresh data that reflects current real-estate trends. If a subtle shift in user behavior or listing language emerges, it may reintroduce biases. Continuous monitoring combined with threshold alerts for fairness metrics is essential. If triggered, investigate the cause, retrain the model, or remove new spurious features.
How do you communicate these complex fairness measures to non-technical stakeholders?
Use straightforward comparisons of error rates, predicted prices, or recommendation exposures across demographic groups, accompanied by simple data visualizations. Show changes over time. Avoid deep technical jargon. Emphasize that the model is tested on large, representative samples and consistently shows minimal disparities across protected groups. Provide short statements explaining why fairness matters both ethically and for user trust.