
ML Case-study Interview Question: Automated Ad Budgeting with ML-Synthesized Cost Curves


Browse all the ML Case-Studies here.
Case-Study question
You are leading a marketing automation initiative at a large online platform that spends millions of dollars weekly on digital ads. The marketing team manages thousands of campaigns across multiple channels. Some campaigns show sparse or inconsistent historical data, while others are large and heavily clustered in a narrow spend range. The goal is to programmatically determine the best budget allocation across channels and campaigns to maximize new-user conversions while respecting a fixed overall budget. How would you design a system that:
Attributes conversions to specific campaigns and channels in a modified last-touch manner.
Learns channel-level cost curves to decide budget splits among channels.
Extends cost-curve modeling down to the individual campaign level, despite sparse and noisy data.
Uses machine learning to generate synthetic data that can fill in gaps and reduce curve instability.
Integrates these models into an end-to-end platform that automatically sets and updates bids per campaign.
Explain your proposed architecture, key modeling decisions, and how you would ensure the system’s stability and reliability as it scales.
Detailed Solution
Attribution Data and the Modified Last-Touch Approach
Attribution data indicates which campaigns and channels contributed to each user’s conversion. Modified last-touch attribution assigns the full credit to whichever campaign was the last to engage the user before sign-up or purchase, with adjustments for multi-channel touchpoints. The attribution must be fine-grained per campaign to draw reliable cost curves. Real-time or near-real-time data ingestion pipelines collect events from all channels and store them, enabling weekly (or more frequent) aggregation for each campaign.
Cost Curves and Their Significance
A cost curve shows the relationship between marketing spend (horizontal axis) and the resulting conversions (vertical axis). These curves typically exhibit diminishing returns: the more you spend, the less each additional dollar contributes. To optimize spend, repeatedly allocate incremental budget to the campaign (or channel) whose cost curve’s derivative is highest at its current spend. At equilibrium, all active campaigns have the same marginal conversion rate.
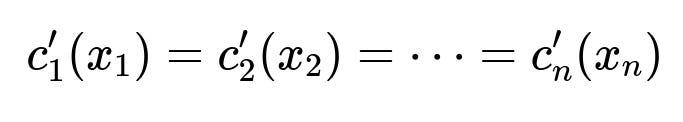
Here c'_i(x_i) is the slope (derivative) of campaign i’s cost curve with respect to spend x_i. Equalizing these slopes at the budget constraint yields the optimal allocation.
Channel-Level Optimization
A simpler approach is to model spend and conversions at the channel level. Aggregate weekly spend and conversions for each channel, fit a concave function to the data, and compute the optimal spend by equalizing slopes. Then sum to the total budget. This is effective for broad allocations but cannot automate campaign-level bidding. Manual bidding within each channel is still required.
Campaign-Level Challenges
Some channels contain thousands of small campaigns with sparse historical data, resulting in unreliable curves if the data is used directly. Other large campaigns show data points only at high spend, leaving the low-spend range empty. This clustering makes the fitted function overly sensitive to small changes. Even small noise in the data causes big shifts in the curve.
Machine Learning for Synthetic Data
A single model is trained to predict conversions at any potential spend for any campaign, using historical data from all campaigns. By learning campaign similarities, it can generate realistic conversion estimates in spend ranges that have limited direct observations. Features typically include targeting, creative size, bidding strategy, region, device type, and other metadata. After training, synthetic points are created for spend levels where real data is missing. These synthetic points merge with the real data to produce a more robust cost curve.
Per-Channel ML Model
Training a separate model per channel is beneficial when channels differ significantly. However, each model can still learn from other channels by including channel-specific weights in the loss function. If a channel stands to benefit from another channel’s data, the model tunes that cross-channel weight high; if not, it remains low. Hyperparameter search (for example, via scikit-optimize) finds the best blend of channel data and the best model configuration, guided by a validation set of recent data from that channel.
Dynamic Synthetic Data Generation
Each campaign has its own optimal number of synthetic data points. Campaigns with robust historical coverage need fewer synthetic points, while campaigns with sparse data need more. A grid search is run for each campaign, testing how many synthetic points yield the lowest validation error on the resulting cost curve. Parallelization (for example, using joblib.Parallel) speeds up this large-scale search.
A Python snippet illustrating parallel synthetic data generation:
from joblib import Parallel, delayed

def generate_synthetic_data_for_campaign(model, campaign_data, spend_grid):
    synthetic_points = []
    for spend_level in spend_grid:
        predicted_conversions = model.predict(campaign_data, spend_level)
        synthetic_points.append((spend_level, predicted_conversions))
    return synthetic_points

campaign_ids = [...]  # Thousands of campaigns
results = Parallel(n_jobs=-1)(
    delayed(generate_synthetic_data_for_campaign)(trained_model, data[cid], spend_grid[cid])
    for cid in campaign_ids
)
Automated Bidding Platform
Once reliable campaign-level cost curves exist, the platform can automate bidding:
Predict conversions for a range of spend levels.
Fit a concave function to real plus synthetic data.
Run the slope-equalization algorithm across all campaigns to find each campaign’s spend target.
Deploy new bid settings and budgets to the channel partner programmatically via an ads API.
Stabilizing and Scaling
Data is ingested weekly (or daily for faster cadence). Each pipeline run updates the attribution data, retrains (or incrementally trains) the ML models, and recalculates spend targets. Caps are usually placed on each campaign’s maximum allowable spend to avoid extrapolating far beyond historical ranges. This prevents overconfident allocations if the model incorrectly believes higher spend will yield a strong return.
What if the interviewer asks the following questions?
1) How can you measure or validate the correctness of the cost curves?
Accuracy is checked by holding out a recent slice of data from each campaign as a validation set. Fit the cost curve using the training set and synthetic points, then predict conversions at actual spent values in the validation set. Compute the error or percentage difference between predicted conversions and actual conversions. If error is high, reduce or increase synthetic data points. If error remains high, check for feature drift or missing metadata.
2) How would you adapt this system for near-real-time bidding?
Keeping the same architecture, run smaller incremental updates more frequently. Batch new data (for example, the last hour or day of spend-and-conversion events), retrain or partially retrain the model, generate updated cost curves, and push new bids. This requires efficient streaming or micro-batching of attribution data, plus a robust engineering pipeline to avoid blocking the system with heavy training jobs. A possible workaround is to train a large model offline (daily or weekly) while using a lightweight online correction layer that nudges bids more frequently based on short-term fluctuations.
3) What happens if you use an ML model to optimize for lifetime value instead of just immediate conversions?
Change the target from short-term conversion counts to predicted long-term revenue from each user. The training data would include multi-week or multi-month user behavior. The cost curves would now map spend to predicted total future revenue, not just initial conversions. The slope metric becomes marginal return on ad spend rather than marginal number of sign-ups. The process stays the same, but instead of a conversions vs. spend curve, the system fits an expected lifetime value vs. spend curve.
4) How do you handle seasonality?
Seasonality can skew weekly data significantly. One approach is to include temporal features (day of week, month, holiday flags) in the model. Another is to maintain a baseline for each campaign’s typical performance during each seasonal period. Either method ensures the synthetic data generation accounts for known cyclic fluctuations. Rapid shifts (such as major holidays) might need either additional features or short-term, special-case adjustments to the predicted curves.
5) Why use separate models for each channel if you also allow cross-channel learning?
Each channel has unique mechanics, targeting, and user demographics. Separate models let each channel learn its own patterns more precisely. Cross-channel knowledge transfer emerges through weighted sharing of data. A single monolithic model might conflate channel nuances or add overhead in hyperparameter tuning. A channel-specific approach balances shared learning with specialized modeling.
6) What are common pitfalls in implementing a multi-channel automated bidding system at scale?
Underestimating data quality issues (incomplete or mislabeled events), building a single model that is too generic and overlooks channel-specific nuances, failing to cap spend well outside the historical domain, ignoring campaign-level differences in sensitivity to synthetic data, or not periodically checking for model drift. Other pitfalls include slow data pipelines that prevent timely updates, and partial integration with channel partner APIs that leads to inconsistent bid application times.