
ML Case-study Interview Question: Predicting Travel CLV at Scale using Gradient Boosting and MLOps Pipelines

Browse all the ML Case-Studies here.
Case-Study question
A large online travel platform wants to predict the long-term monetary value each customer will generate. They have multiple brands in different regions, handle various travel products such as stays, flights, packages, and manage hundreds of millions of customer records. They also store detailed booking and engagement histories. They want to build an end-to-end production pipeline that re-trains monthly and generates daily predictions of each customer's future 12-month net revenue. How would you, as a Senior Data Scientist, design and implement a scalable, accurate, and well-monitored Customer Lifetime Value (CLV) model for this scenario?
Detailed solution
Use a machine learning approach to capture complex patterns in both purchase behavior and engagement signals. Include multiple components such as data extraction, feature creation, modeling, evaluation, and deployment. Ensure robust operations for continuous integration and automated retraining. Below are the main steps.
Data
Extract historical bookings from all brands into a unified dataset. Include recency, frequency, and monetary features. Create engagement features from email interactions, app usage, and website clicks. Construct a cutoff date to split past data for features and future data for the target. During model training, treat the 12-month future revenue (gross) as the target. Subtract or adjust for cancellation probabilities with separate multipliers.
Modeling Approach
Segment customers by region, recency, and frequency. Train a gradient-boosted regression model (for example CatBoost) in each segment to capture non-linear relationships and high-cardinality categorical variables. Use clipping for outliers at an upper percentile.
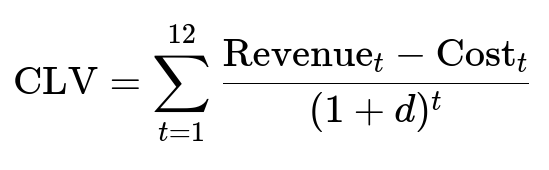
Here, Revenue_t is the revenue in month t, Cost_t is the associated cost, and d is a discount rate. In practice, you might model the raw or partially discounted revenue and then adjust with multipliers for cancellations or fees.
Training and Evaluation
Split the data into train and test sets. Train on the train set. Generate predictions on the test set. Measure: Gini or Lorenz curve to check the model’s ability to rank high-value customers. Calibration plots to confirm predictions align with actual averages. Bias metrics by subgroup (e.g., time since last booking). Root Mean Squared Error (RMSE) or Mean Absolute Error (MAE) for aggregate accuracy.
Production Pipeline
Use a containerized workflow where each step is run on a Kubernetes-based platform:
Data pipeline: Read and join raw booking data with engagement logs, compute features, and store them.
Model training pipeline: Retrain each month using the latest data. Store the trained models in a Model Repository.
Scoring pipeline: Run daily to generate updated CLV predictions. Summarize them for downstream systems.
Monitoring and logging: Capture training metrics, scoring run times, resource usage, and handle alerts on failures.
Example Python snippet
import catboost as cb
from sklearn.model_selection import train_test_split

X_train, X_test, y_train, y_test = train_test_split(X, y, test_size=0.1)

model = cb.CatBoostRegressor(iterations=1000,
                             learning_rate=0.05,
                             cat_features=categorical_cols,
                             verbose=0)
model.fit(X_train, y_train)
preds = model.predict(X_test)
Explain in code comments and your documentation how you derived features, clipped targets, and addressed skew.
Infrastructure and MLOps
Store code in GitHub. Build and push the container image with a CI/CD workflow. Use Airflow for orchestration. Schedule data prep, training, and scoring jobs in a well-defined DAG. Log runs and metrics with centralized tools. Integrate dashboards to track data drift, model drift, and real-time performance.
Future Enhancements
Add additional engagement signals such as website visits, app installs, net promoter scores, or advanced embeddings for behavioral traits. Explore two-stage models (churn probability first, then spend given non-churn). Investigate advanced architectures like deep neural networks if data volume and complexity justify it. Apply interpretability methods like SHAP to understand model outputs.
How would you handle new customers with no historical bookings?
Use cold-start features for new customers, such as marketing engagement (email clicks, app visits) or region-level averages. Train a specialized segment or a separate model for new users. Regularly refresh engagement data so even minimal activity can refine early-stage CLV predictions. Confirm calibration with a short-term holdout set of newly on-boarded accounts.
How do you address skewed and heavy-tailed target values in CLV?
Clip extreme outliers in the training set to a high percentile (e.g. 99.9th). Evaluate transformations such as log(y + 1) or a robust loss function. Use custom loss if needed to reduce overfitting to large outliers. Compare evaluation metrics with and without transformations to ensure stability.
Could you explain how you manage cancellations and refunds?
Train a separate cancellation model or use historical cancellation rates stratified by region, product type, or booking channel to derive multipliers. Apply these multipliers after predicting gross CLV to yield net CLV. Adjust your final predictions daily as new data on cancellations comes in.
How do you ensure your pipelines scale with massive datasets?
Drop unneeded or expensive features. Consolidate booking stats with aggregate functions (e.g. sum, mean, min, max) rather than row-by-row computations. Use distributed systems like Spark on your data lake and container-based clusters for parallel processing. Leverage cluster tuning and caching when constructing large-scale features.
How do you track model performance over time?
Adopt model monitoring. Continuously track differences between predicted and actual spending. Segment these metrics by region, recency, booking channel, or loyalty tier. Trigger alerts if drift is detected in input distributions or if error metrics degrade. Use an A/B test if you apply CLV predictions in a marketing or personalization campaign to validate the impact on key metrics (e.g. retention rate, marketing ROI).
Why segment by booking recency and frequency instead of a single global model?
Different segments exhibit varied behaviors and distributions. Very frequent travelers often behave differently in how they respond to brand loyalty or promotions compared to occasional travelers. This segmentation approach is especially helpful in dealing with long tails in the booking-value distribution. It also simplifies feature engineering, enabling more targeted hyperparameter tuning in each segment.
How would you deal with non-stationary effects such as global events or sudden changes in travel trends?
Shorten the training window or implement time-based weighting so recent patterns matter more. Maintain rolling backtests to see how well the model generalizes through different market conditions. Supplement your model with event-driven adjustments or perform outlier detection on abrupt pattern shifts.
How do you guarantee your entire MLOps lifecycle is secure and compliant?
Use a hardened Kubernetes environment with RBAC (Role-Based Access Control). Keep data encrypted at rest and in transit. Enforce logging, monitoring, and alerting on suspicious activities. Restrict production write-access privileges to only the pipeline or service accounts. Ensure compliance with data privacy laws by anonymizing or pseudonymizing personal information.
How do you explain to stakeholders why model-based CLV is better than a simple RFM approach?
Highlight how RFM lumps customers into broad buckets, ignoring many engagement and contextual signals. Emphasize that a machine learning approach can incorporate marketing campaigns, brand usage diversity, platform usage data, and churn indicators. Show numeric evidence such as better Gini scores and improved campaign ROI.
How do you handle real-time or near-real-time scoring?
Batch predictions suffice for many CLV use cases. For near-real-time, maintain a streaming pipeline to update features (like last booking date or new engagements) in micro-batches. Keep a low-latency inference endpoint or serverless function that can handle single-customer queries. Validate that your system can scale to high request volumes with minimal latency.
In what ways might you improve model explainability?
Analyze feature importances. Use partial dependence plots or SHAP values to see how each feature influences predictions. Implement a post-hoc interpretability dashboard that shows stakeholders key drivers behind individual or segment-level predictions. Confirm the results align with domain intuition.
When would you choose a deep neural network over CatBoost?
Explore a deep approach if the data is very high-dimensional, there are complex interactions not captured by tree ensembles, or if you plan to embed raw behavior sequences or text. Test carefully because neural networks typically require more tuning, and tree-based methods often perform competitively on tabular data.
Would you consider a two-stage approach for churn and spend?
Yes. Predict churn probability as stage one, then predict spend among those predicted to remain active as stage two. Multiply these predictions to get an overall CLV. This approach captures the separate drivers of churn vs. spend volume. Monitor the error propagation between stages.
How do you approach hyperparameter tuning?
Use random search or Bayesian search with cross-validation. Tune key parameters like learning_rate, depth, and l2_leaf_reg for CatBoost. Evaluate best settings in a holdout set. Check for overfitting by looking at training vs validation error. Refresh these hyperparameters periodically.
What if you wanted to incorporate marketing treatments to maximize CLV?
Formulate an uplift modeling approach. Instead of just predicting future value, estimate the incremental impact of marketing interventions on that value. Combine your CLV predictions with these uplift estimates to optimize marketing allocations. Deploy experiments for robust causal inference.
How do you reduce memory usage in your large-scale feature computations?
Summarize repeated operations into aggregates. Avoid storing full transaction logs at once. Stream data in chunks. Use efficient data types (e.g. smaller numeric data types when possible). Distribute computations with Spark or a similar framework. Validate partition sizing to avoid driver overload.
How do you verify the final CLV predictions are actually used in downstream applications?
Maintain close contact with relevant teams that use CLV in marketing, budgeting, or loyalty programs. Build end-to-end integration tests that confirm daily predictions arrive in the correct data store or API. Track usage metrics in those downstream systems (e.g. how many queries or marketing campaigns reference CLV).
What key pitfalls must you avoid?
Overfitting to historical anomalies, ignoring margin or cancellation rates, or failing to keep the pipeline modular for easy debugging. Avoid letting stale segments or features drift away from real-world patterns. Always check each stage in CI/CD for data leakage or pipeline breaks.