
ML Case-study Interview Question: CatBoost Quantile Regression for Marketplace Shipment Delivery Time Estimation.

Browse all the ML Case-Studies here.
Case-Study question
A rapidly growing online marketplace wants to introduce an accurate delivery time estimation feature for buyers selecting a Pay-and-Ship option. The platform currently shows only the shipping cost and courier provider but does not display any estimated delivery date. Product sellers on this marketplace are regular individuals rather than organized merchants. The company suspects that showing a reliable delivery date range will increase conversions and reduce user dissatisfaction when deliveries arrive later than expected. How would you design a solution to estimate the expected delivery time for each item, given historical data on past shipments? Propose potential approaches, outline the modeling steps, and describe how you would validate and deploy such a model at scale.
Detailed Solution
Understanding the Core Problem
Accurate delivery time estimation is essential for user satisfaction. The platform has two main time components. Sellers usually spend some time handing over the package to the courier. The courier then takes a certain time to deliver. These two elements together form the total delivery time.
DeliveryTime=SellerTime+CarrierTime
DeliveryTime is the total time in days, SellerTime is how long the seller takes to dispatch, and CarrierTime is how long the courier service takes to deliver. Historical data includes timestamps from each stage, which allows you to split these components and analyze them separately.
Data Analysis and Baseline Creation
Analyzing historical shipping events reveals how different courier providers perform, average seller response times, and any geographical factors like distance between regions. A quick baseline can be created using mean or median delivery times per provider. This proves whether having any range displayed at all helps user decision-making.
Testing the baseline ranges (for example, 3–5 days) offline shows what fraction of deliveries fall inside or outside the predicted window. If the ranges catch most deliveries, the approach is already helpful. This baseline can be tested online with an A/B experiment to see if conversions improve.
Building a More Advanced Model
Machine Learning can capture nuances like specific day-of-week effects, distance between seller and buyer, different courier performances, and even special holidays.
The company tested multiple regression models. A gradient boosting model (CatBoost) worked well, especially with categorical variables (courier provider, region, day-of-week). The model uses historical shipments as training data with features like shipping provider, pickup location, and possibly the item category.
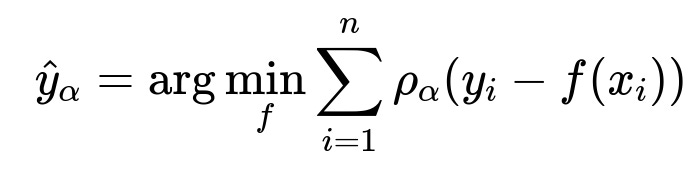
Here, y_i is the actual delivery time for the i-th shipment in the dataset, x_i is its feature set (such as distance, courier, day-of-week), and f(x_i) is the predicted time. The function rho_alpha is the quantile loss function. For alpha=0.05, the model estimates a lower bound. For alpha=0.95, it estimates an upper bound. Combining both yields a predicted range.
Python Code Example
Below is a simplified illustration for training two CatBoost models. One targets the lower quantile and the other the upper quantile.
from catboost import CatBoostRegressor
import pandas as pd

data = pd.read_csv("delivery_data.csv")
X = data[["courier", "region", "distance", "day_of_week"]]
y = data["delivery_time"]

model_lower = CatBoostRegressor(loss_function="Quantile:alpha=0.05", iterations=1000, depth=6)
model_lower.fit(X, y, cat_features=["courier", "region", "day_of_week"])

model_upper = CatBoostRegressor(loss_function="Quantile:alpha=0.95", iterations=1000, depth=6)
model_upper.fit(X, y, cat_features=["courier", "region", "day_of_week"])

# Inference
X_new = pd.DataFrame({
    "courier": ["CourierA"],
    "region": ["RegionX"],
    "distance": [200],
    "day_of_week": ["Monday"]
})

lower_pred = model_lower.predict(X_new)
upper_pred = model_upper.predict(X_new)
print("Predicted Range:", lower_pred, "to", upper_pred)
Offline Evaluation
Quantile models generate a predicted range. Offline validation shows how often actual delivery times land within these intervals. This is more user-friendly than a single-point estimate. More precise intervals reduce late arrivals beyond the stated range, improving trust.
Production Deployment
Batch predictions are suitable if you only have seller-based data at listing time. Scheduling a pipeline with Airflow can generate predictions for each new listing once a day. The final output is stored, then displayed to users. If the solution eventually requires real-time buyer-specific info (e.g., buyer location), an online prediction service can be introduced later.
Steps include:
Automated data extraction and feature engineering in a daily job.
Model training or retraining using experiment-tracking (MLflow), with containerization (Docker) for consistency.
Deployment with internal tools or on a scalable cloud platform.
Monitoring for data drift and model performance to trigger retraining when needed.
What challenges might arise if the model predictions are consistently off?
Inconsistent or highly optimistic estimates generate user frustration when deliveries arrive late. It can reduce user trust. Correcting this requires monitoring the fraction of packages that exceed predicted ranges. A possible fix is retraining with more recent data or adjusting quantiles to yield more conservative estimates.
How would you handle scenarios where sellers delay shipping much more than average?
Outliers exist if some sellers take too long. One approach is to detect such anomalies and either exclude them or weight them differently in training. Another approach is building separate segments for typical vs. slow shippers. Online flags for users might also warn about potential delays, but that is a business decision.
How do you verify the ROI of this feature?
Run an A/B test: one variant shows the delivery date range, and the other does not. Compare conversion rates, bounce rates, and user satisfaction metrics. If the segment with the estimated delivery range outperforms in conversions or user feedback, it indicates clear ROI.
How do you ensure performance in production with potential data and concept drift?
Ongoing monitoring is essential. Track real delivery durations and compare them to predictions daily. If the error distribution shifts significantly, or if new shipping options appear, the model must be retrained. Automated pipelines can streamline this process, ensuring updated models that reflect the current data reality.