
ML Case-study Interview Question: Predicting SaaS Churn & Upsell with Scalable, Explainable XGBoost and SHAP Insights

Browse all the ML Case-Studies here.
Case-Study question
A fast-growing SaaS enterprise seeks a system that can predict both churn and upsell opportunities across its existing B2B customers. The sales representatives currently rely on extensive manual research to determine which accounts are most likely to expand or discontinue services. These representatives also struggle to trust purely numeric model outputs without a clear explanation. The enterprise wants a fully scalable, AI-driven solution to (1) generate reliable churn and upsell propensity scores for each account, (2) produce clear narrative insights explaining why a certain account is assigned a given score, and (3) integrate these recommendations into a CRM platform so the sales team can take actionable steps.
They face challenges in defining ground-truth labels for churn and upsell in a subscription model that allows mid-cycle contract additions. They also need advanced time-series features for early predictions, before the final renewal date. The solution must handle large-scale data, incorporate interpretability approaches like SHAP or LIME, and present domain-relevant explanations that resonate with non-technical sales professionals.
Design an end-to-end data science pipeline to meet these requirements. Propose how you would handle label generation, feature engineering, model training, explainability, and integration into CRM workflows. Detail your approach to iterative improvements, A/B testing, and any next steps for future enhancements.
Detailed Proposed Solution
Churn and Upsell Modeling
Training separate regressors for churn and upsell helps isolate unique patterns for each outcome. One robust approach uses XGBoost, which aggregates many decision trees to capture nonlinear relationships. The prediction for each account x can be written as a sum of tree contributions:
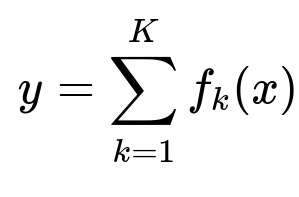
Each f_k is a decision tree, and K is the number of trees. XGBoost learns these trees in sequence, optimizing a loss function that measures errors between model predictions and ground-truth labels.
Historical contract and usage data is split into training and validation sets. Model hyperparameters (like max_depth, learning_rate, and n_estimators) are tuned via grid search or Bayesian optimization. Precision, recall, and AUC are tracked to identify the best-performing model checkpoint.
Overlapping Time Windows for Label Generation
Churn typically occurs during renewal periods, while upsell can occur mid-contract. Using only the final renewal date undercounts mid-cycle add-ons, leading to poor labels. A remedy is overlapping time windows. If an account adds more seats or products at month 5, label that prior window as an upsell instance. If it reduces seats at month 11, label that adjacent window with churn. Repeated overlapping windows expand training samples and ensure that mid-cycle events are properly captured.
Early Prediction Challenges
Sales teams need enough lead time to mitigate churn and plan upsells, so predicting near the renewal date might be too late. Rolling time-based features (like product engagement over the last 3, 6, or 9 months) captures shifting account behavior. Monthly account scoring ensures the model frequently refreshes. Recent usage trends, macroeconomic signals, and competitor hiring flows are included as predictors.
Explainable AI Engine
Generic feature-importance lists (e.g., from SHAP) can confuse non-technical teams. A user-facing interpretability engine converts model outputs and feature importances into narrative explanations. Model interpretation components like SHAP generate local feature importances for each account. An internal library then groups semantically similar features, applies textual templates (e.g., “This account’s usage increased from X to Y in the last 3 months (+Z%).”), and ranks the final narratives by importance. Removing redundant or overlapping explanations avoids clutter.
End-to-End Pipeline Implementation
A large-scale platform (such as Apache Spark) processes the data in batches, merges it with the latest account engagement metrics, and calls an internal ML framework to run XGBoost training and inference. Each account is scored monthly, producing a churn risk score and upsell propensity score. The interpretability engine then transforms these scores into user-friendly sentences that highlight the most relevant drivers.
Below is a brief Python snippet showing how scores can be computed and then passed into an interpretability step using SHAP. The final narratives would be generated downstream.
import xgboost as xgb
import shap
import pandas as pd

# X_train, X_test, y_train, y_test are prepared with the overlapping labels
model = xgb.XGBRegressor(n_estimators=200, max_depth=6, learning_rate=0.1)
model.fit(X_train, y_train)

# Predict churn or upsell
y_preds = model.predict(X_test)

# Compute SHAP values for local interpretability
explainer = shap.Explainer(model, X_train)
shap_values = explainer(X_test)

# Convert top local feature importances into narrative segments
results = []
for i in range(len(X_test)):
    account_id = X_test.index[i]
    local_importances = shap_values[i].values
    # A custom logic can map each feature importance to narrative
    # results.append(...)
Integration into CRM
Account-level predictions and short textual insights are surfaced directly in the CRM platform. A button or tooltip near the score reveals the top 2-3 drivers of the predicted risk or upsell potential. Sales representatives quickly cross-check these insights (e.g., “hiring slowdowns,” “declining usage,” “industry expansions”) with their own domain knowledge before contacting the client.
A/B Testing and Impact
An online A/B test tracks whether the model-driven approach yields higher renewal incremental growth compared to existing heuristics. One group of representatives sees the new predictive insights plus narrative explanations, while a control group sees only their usual data. Uplift in expansion revenue is measured over a quarter. A typical gain of around 8% has been observed when these predictions and narratives are shown.
Future Enhancements
Automating the generation of narrative templates reduces the time spent maintaining the interpretability engine whenever new features are introduced. A more unified multi-task approach can combine churn and upsell predictions into a single framework. Streamlined model updates ensure that newly available data or feature drift is addressed quickly.
How Would You Handle These Follow-Up Questions?
1) How do you validate the correctness of churn labels during the overlapping time windows?
Construct validation slices where each time window’s churn outcome is confirmed against actual seat reductions or contract cancellations. Compare predicted churn windows with actual observed events. Measure recall (e.g., how many real churn events were caught) and precision (e.g., how many flagged events ended up as genuine churn).
Defining partial churn is tricky if some products are dropped while others remain. In that case, confirm that partial churn events in the training set align with real invoice or usage data.
2) Why might XGBoost be favored over simpler models here, and how might you address concerns of overfitting?
XGBoost handles diverse feature types, deals well with missing data, and exploits boosting to learn complex interactions. It also offers built-in regularization (e.g., L1/L2 penalties) to mitigate overfitting. Early stopping is another important safeguard. When training, monitor a validation set’s loss and halt if it does not improve after a set number of rounds.
3) How do you choose the most important features to display, given dozens or hundreds of features?
Aggregate SHAP or LIME scores at a higher semantic level. For example, group 10 usage metrics under “product engagement,” and 5 job-metric signals under “company hiring trends.” Select the top one or two groups with the highest average feature importance for the final narrative.
4) What if the sales team is skeptical of black-box models?
Offer simpler proxy explanations. Provide quick ways to compare the new predictions with the historical approach. Expose partial dependence or correlation plots for major features. Let them override the model’s recommendation or add feedback, which can be captured to improve future retraining.
5) How do you ensure the model remains accurate when macroeconomic conditions shift drastically?
Retrain or fine-tune the model more frequently and incorporate real-time macro-level signals. Maintain a rolling data window so that newly captured behavior (e.g., cyclical hiring slowdowns) is not overshadowed by outdated trends.
6) How do you integrate deep learning approaches into the pipeline if you want to explore them later?
Add a separate deep learning component that ingests the same time-series features or raw event logs. The pipeline can store the inference results from both the deep model and the XGBoost model. Use ensemble techniques or model stacking to combine them. The interpretability engine would have to incorporate additional logic to parse outputs of neural networks into meaningful narratives.
7) How would you detect data leakage or ensure the model is not using future information during training?
Partition data by time, ensuring that any feature computed post-churn (or post-upsell) does not contaminate training examples. If there is a feature that inadvertently encodes near-future events (e.g., invoice changes logged after a partial renewal), remove or shift it backward in time so it matches the real-world availability.
8) How can you maintain performance and trust while scaling to more products or higher data volumes?
Automate feature generation and narrative clustering. Modularize the feature store so new product usage data can be integrated seamlessly. Establish robust data governance and consistent feedback loops from sales to data teams. Use cluster or cloud-based infrastructure (e.g., Spark) for parallel data processing and large-scale inference.