
ML Interview Q Series: A/B Testing for ML Model Validation: Design, Metrics, and Statistical Significance.
📚 Browse the full ML Interview series here.
A/B Testing a Model Change: You have developed a new version of a machine learning model that you believe is better than the current production model. How would you design an A/B test to validate that the new model is indeed an improvement? *Explain how you would set up the experiment (splitting traffic or users), what metrics you would observe (e.g., business KPIs as well as model metrics), and how you’d determine statistical significance of the results.*
Experiment Design and Overview
A crucial step is to ensure your new model’s performance is measured under realistic production conditions. An A/B test (also referred to as a split test) helps establish whether the new model brings actual improvements rather than simply performing well on offline metrics. The core idea of A/B testing is to present some portion of your users (or traffic) with the new model (Variant B) while the rest of the users continue to receive the old model (Variant A). Because both variants run in parallel and the user assignment is randomized, external influences on user behavior tend to average out. This forms the basis for making statistically valid comparisons.
Key Goals and Considerations
It is important to keep sight of business KPIs alongside predictive metrics. A new model might be more accurate in terms of certain error metrics (like accuracy, precision, recall, RMSE, or other direct model outputs), but it is only truly better if it also leads to better real-world outcomes such as increased revenue, improved user engagement, or higher customer satisfaction. Understanding how your model’s success maps into business metrics is often more challenging and more valuable than simple offline measures.
Choosing Users versus Traffic Splits
There are two main ways to direct some percentage of real-world data to each model. You can randomly assign users or randomly assign traffic (i.e., individual requests). In user-centric products (e.g., social media platforms), user-level splits ensure that each user consistently experiences only one version of the model. This avoids confusion for users who might see inconsistent experiences if their requests are split. By contrast, in high-traffic systems like search engines, you might choose to split requests themselves. The choice depends on the nature of the product and on how stable you want the user’s experience to be during the test.
If the product is a recommendation engine, user-level splits are generally a better design because the user’s experience remains consistent throughout the experiment. If the product is something like an API that processes many calls that are not user-specific, splitting based on requests can be feasible.
Implementation Details of the Split
One simple approach is to use a random hashing strategy. For instance, if each user has a unique user ID string, you can hash the ID and map it to an integer. Then decide that a certain range of hashed values (for example, those whose hash mod 100 falls within 0–49) go to Variant A, while the others (those whose hash mod 100 falls within 50–99) go to Variant B. This ensures stable assignment (the same user will always end up in the same variant) and a known proportion of users goes to each variant.
Alternatively, you can keep an assignment table in your system, storing each user’s group assignment. Whenever a request arrives, you check the user’s group from the table. This also works for request-level splitting: you take each request, compute some random key, and then direct it to the appropriate model based on that random key. The main point is to avoid any bias in how you assign users to the two variants.
Metrics to Observe
You generally want a combination of direct model metrics and overall business metrics:
Model performance metrics: These can be standard classification or regression metrics such as accuracy, F1 score, precision, recall, MSE, or log loss. If you are dealing with ranking or recommendation systems, you may monitor metrics like NDCG or MRR. The choice depends heavily on the business problem domain. If your new model is an NLP system, you might track BLEU or ROUGE scores (though these are more offline) alongside user-oriented click metrics to see if people engage more with the new system’s outputs.
Business KPIs: Ultimately, the improved user experience or increased profitability is the real reason for shipping a new model. If your application is an e-commerce site, you might track conversion rates, average cart size, repeat purchase rates, or the overall revenue per user. For content-based platforms, watch time or session duration is often used. For consumer apps, user retention is also a major KPI. Sometimes your new model might show improved direct metrics but lead to lower user engagement for reasons like interpretability or UI confusion. That’s why it is critical to measure real-world user metrics.
User engagement metrics: This can include dwell time, bounce rate, click-through rate, or any other measure that captures how users interact with your product. If the new model changes the user experience in ways that are not captured by immediate business metrics, these engagement metrics can signal early whether users actually prefer the new approach.
Reliability and latency metrics: If your new model is more compute-heavy, it might slow down your product or cause more system errors/timeouts. So track average latency, 95th percentile latency, or error rates. If a new model yields better predictions but drastically impacts system stability or speed, the net effect could still be negative.
Duration of the A/B Test
The test has to run long enough to gather sufficient data to establish a statistically significant difference between the two variants. This duration depends on many factors, including traffic volume, baseline conversion rates, and the magnitude of the difference in performance you expect. If your site has very high traffic, you can often detect differences quickly. If you have lower traffic or smaller effect sizes, you will need a longer experiment to reliably tease out differences. It is generally wise to use power analysis techniques to estimate the minimum sample size required.
Statistical Significance
The heart of A/B testing is verifying that your observed difference in metrics between the new model (Variant B) and the old model (Variant A) is unlikely to be due to random fluctuations. A common approach is to estimate the metric of interest in both groups and use a hypothesis test. Under the null hypothesis, assume there is no difference, and you want to see whether your measured difference in means (or proportions, in the case of CTR or conversion rates) is large enough to be considered unlikely to have occurred by chance.
A typical approach is a two-sample t-test for continuous metrics or a z-test for proportion metrics such as CTR. In a simplified notation for a difference in means test, the test statistic can be computed by subtracting the mean for group A from the mean for group B, then dividing by the standard error of that difference.
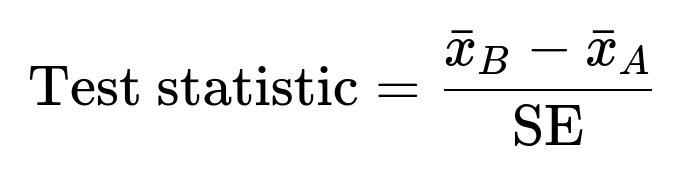
Where (\bar{x}_B) is the mean metric value in Variant B, (\bar{x}_A) is the mean metric value in Variant A, SE is the standard error of the difference, which is typically derived from the variance within each group and the sample sizes.
If the test statistic exceeds a certain threshold corresponding to your significance level (often 0.05), you conclude that you have sufficient evidence to reject the null hypothesis. If the p-value is small, you infer that the difference in performance is statistically significant. In practice, data scientists also consider effect sizes, confidence intervals, and domain context. You may use a standard frequentist approach, or some teams prefer a Bayesian framework for A/B testing to incorporate prior knowledge and interpret the results in a more intuitive posterior probability manner.
Below is a small Python code snippet (purely illustrative) demonstrating how you might use a standard library like SciPy to check a difference in means if you were collecting some numeric metric from your experiment:
import numpy as np
from scipy import stats

# Suppose you have arrays of metric observations from users in each variant
metric_old_model = np.array([...])  # Observed values for group A
metric_new_model = np.array([...])  # Observed values for group B

t_stat, p_value = stats.ttest_ind(metric_old_model, metric_new_model, equal_var=False)

alpha = 0.05
if p_value < alpha:
    print("Statistically significant difference found.")
else:
    print("No statistically significant difference found.")
If you are dealing with a conversion rate or another proportion-based metric, you might use a proportion z-test. Tools such as statsmodels in Python have built-in methods for that purpose.
Combining Statistical Significance with Practical Importance
Statistical significance only tells you if an observed difference is unlikely to be chance. It does not necessarily tell you that the difference is large enough to be meaningful. Therefore, it is important to note effect size. A minimal detectable effect (MDE) is often established at the beginning: you might say you need at least a 2% improvement in your conversion rate, or a 5% increase in a certain KPI, to justify shipping the new model. If your difference is statistically significant but only 0.01% in absolute terms, the business might not see enough benefit to justify deploying the new model (especially if it is more expensive to run).
Guarding Against Common Pitfalls
When running the test, you need to ensure that no major changes outside the scope of the experiment coincide with the test period, as this can confound the results. Also watch out for novelty effects: sometimes a new experience can be interesting just because it is new, but that effect might wear off over time. Another pitfall is peeking at the results too often and making decisions prematurely. Repeated significance testing without proper correction can lead to inflated false-positive rates. Ideally, define the stopping rule for your test in advance to ensure a valid inference when it concludes.
Practical Implementation Guidance
Decide on the traffic split. Common splits are 50/50 or 90/10. A 50/50 approach gives you faster significance detection but can be riskier if your new model might degrade user experience. A 90/10 approach is safer because most users still get the stable old model, but the smaller sample in the new variant might delay your ability to see significant differences. Some teams do a stepwise ramp-up: start with 5% of traffic, then expand to 20%, then eventually 50% as you gain confidence.
Ensure logging and analytics are robust. Track how many impressions or user visits each variant sees, store the relevant user or request IDs, and log the outcome metrics. If something goes wrong, you need a reliable way to roll back to the old model.
Account for any potential cluster effects. For instance, if your platform experiences a heavy shift in usage patterns on weekends versus weekdays, you might want to run the test across a full business cycle. Or if certain geographies respond differently, randomize consistently so that geographic distribution is balanced between variants.
Perform thorough post-test analyses, including subpopulation checks. You might want to see whether the new model performs significantly better for new users but not for existing power users, or vice versa. If you do multiple comparisons, be mindful of the multiple testing problem. Adjust your p-values accordingly or apply false discovery rate controls if you do many slice analyses.
Final Decision
If the metrics show both statistical and practical significance in favor of the new model, you have strong evidence to replace the old model with the new one. However, if the difference is not significant or is negative, you either continue iterating on the new model or keep the old one in production. In complex scenarios, you might even run multiple experiments simultaneously, but that complicates the analysis and requires a good experimental design to avoid cross-interference.
How would you ensure that the sample sizes for each variant are sufficient?
You can estimate this through a power analysis, which clarifies how big a sample is needed to reliably detect a certain effect size at a given significance level. If you anticipate a 2% improvement over the baseline conversion rate, for example, and want 80% or 90% power, you can use standard power analysis equations or a specialized software package. If you have prior data on your baseline performance, you can plug that into your power calculations. If the required sample size is larger than your typical daily traffic, you will know that the test must run for enough days or weeks until the required sample size is met.
You also need to confirm each variant is stable across the full duration of the test (i.e., the new model or the old model is not altered mid-test). This ensures that any difference in performance is due to the model itself and not due to a mismatch in user populations or external changes that happen randomly.
What about potential novelty or learning effects in real-world usage?
Sometimes a new interface or model can look great during the initial period because users are curious about the change, leading to artificially high engagement. Conversely, some new features may have a learning curve, so users might initially be slower to adapt, making the new variant look worse at first. To manage these effects, run your experiment long enough to capture user habituation or learning. Observe the metrics over multiple time segments. If the new model shows an initial spike and then levels off, see whether it stabilizes to a level that remains consistently better or not. Also consider gating your rollout so you get a stable picture of behavior over time.
How do you handle user biases or unbalanced distributions in the experiment?
If you properly randomize by user ID (or request), each variant should in theory see the same distribution of user types, geographies, devices, and time-of-day patterns. In practice, you might double-check logs and user profiles to verify that each group’s user characteristics are indeed balanced. If you detect a discrepancy (for example, if more premium users ended up in the new variant), you can either re-randomize or apply post-stratification adjustments in your analysis. But generally, a robust random assignment mechanism avoids such bias.
How would you combine offline evaluations with online A/B tests?
Before an online experiment, you usually run offline evaluations on historical data or hold-out sets to ensure the new model has at least the potential to outperform the old one. Offline validation can find glaring issues quickly. Once you are confident in offline performance, you proceed to an online A/B test. During the online test, you might continue to monitor both offline and online metrics. If a mismatch arises (for example, offline metrics say the new model is better, but the online A/B test does not), you investigate whether the offline data distribution was not representative, or whether users behave differently in real usage.
How do you approach analyzing multiple metrics, especially if one metric improves but another gets worse?
It is common in practice to define one or two primary success metrics and then track secondary metrics. For example, the primary metric might be an important business KPI such as conversion rate or user retention. A secondary metric could be some measure of user satisfaction or model accuracy. You analyze whether the primary metric is significantly improved or at least not worsened by the new model, and then check secondary metrics to ensure you did not introduce major regressions. If you see improvement in one metric but a drop in another, you have to weigh which metric is more critical to your business. Sometimes teams define a “guardrail metric” that must not be harmed beyond a certain threshold for the new model to be considered acceptable.
What if your traffic volume is very large and you want to minimize the risk of exposing too many users to a potentially inferior model?
A practical approach is to perform incremental rollouts. You can start by funneling a small fraction of traffic (say 1% or 5%) to the new model. If early signals are good and you do not see major regressions, you increase the traffic to 10%, then 20%, and so forth. Each increase is observed over enough time to confirm that the new model continues to show good performance. The final step is 50% or a full rollout once you have high confidence. This technique minimizes risk to user experience while still letting you gather data on real traffic.
Could you detail more about significance levels, confidence intervals, and how to interpret them?
When you say you use a 5% significance level (alpha = 0.05), you are essentially allowing yourself a 5% probability of wrongly concluding there is a difference (a Type I error) when in fact none exists. A standard approach is to take the p-value from your test statistic and compare it against alpha. If the p-value is below 0.05, you claim statistical significance. However, p-values do not convey effect magnitude, so you also look at confidence intervals around the difference in means or proportions. If the entire confidence interval for the difference is positive, that strongly indicates a meaningful improvement. If it crosses zero, the evidence is weaker. If it is entirely negative, the new model is likely worse.
How do you handle repeated analyses of the same experiment or the desire to end the experiment early?
Teams sometimes start an experiment, peek at the metrics daily, and then stop as soon as they see a significant result. The danger is that repeated peeking can inflate your false positives. One way to handle this is to prespecify “checkpoints” and adjust your significance thresholds accordingly (using methods like alpha spending functions, Pocock boundaries, or O’Brien-Fleming boundaries). Another approach is a Bayesian A/B test, which can sometimes provide a more natural way to continuously monitor the posterior probability of improvement without the same inflation in false positives. If you stop early, make sure you have a robust approach to correct for interim looks at the data.
How would you approach user segments or personalization?
In complex settings, you might suspect that the new model is better for certain segments of users (for example, advanced users or users in specific regions) but not necessarily for others. You can stratify your experiment in a way that ensures each stratum (e.g., region or user type) is balanced between the old model and the new model. After you collect data, you compare performance not only globally but also within each stratum. If the new model is strongly better in one region but slightly worse in another, you might make a product decision based on overall net benefit or consider a region-specific rollout.
How do you ensure reproducibility and auditing of A/B test results?
It is important to store all relevant data: the random assignment mechanism, timestamps of assignments, user IDs, and resulting metrics. Automated experimentation platforms (such as homegrown solutions or third-party solutions) typically handle this by generating experiment IDs, variant IDs, and logs that track which variant each user saw. This allows for consistent post-hoc analysis, replication, and even root-cause investigation if you see anomalies. You might also keep version control of the new model’s code, so you know precisely which model version users saw during the test.
What if the new model is too risky to test on live production traffic?
Some scenarios are sensitive or high-stakes, such as financial models with major regulatory constraints. In these cases, you might run a “shadow deployment” or “champion-challenger” approach, where the new model runs in parallel, but its outputs are not surfaced to end users. Instead, you store logs of what the new model would have predicted, and compare these predictions to the old model’s predictions for the same inputs. This is not a true A/B test because real users are not seeing the new model, but it can be a safer step before you do a limited live test. Once you see that the new model’s decisions are better or at least not worse, and that it handles edge cases well, you can proceed to a small-scale A/B test. This approach is also helpful in regulated industries where you must demonstrate the reliability of the new model before it is visible to end users.
How would you finalize the decision to deploy the new model or revert to the old one?
After the test duration is complete, compile the experiment results. Look at your primary KPIs and confirm that your acceptance criteria have been met. Check your secondary metrics (like latency or error rates) for any regressions. If you see a net positive impact that is statistically significant, you typically proceed with a full rollout. If the results are inconclusive, you may either gather more data by running the test longer or re-examine your test design to see if there was an issue (like insufficient traffic or too much variance). If the new model underperforms, you generally revert to the old model and revisit your assumptions or model training procedures.
How do you handle multiple concurrent experiments?
If you are running many simultaneous experiments, you can inadvertently have interference between them. For example, one experiment might alter the user interface while another tries a new recommendation algorithm. A user who is in both experiments might see conflicting variants. Companies often manage concurrent experiments by using a consistent user bucketing approach, where for each user you determine which experiment they can be placed in, so that each user is in only one test for a given part of the interface or feature set. Alternatively, sophisticated multi-cell experiments can systematically test multiple changes simultaneously, but the design and analysis become more complex, often requiring advanced experimental design methods (e.g., factorial or fractional factorial designs).
How do you handle extremely low event rates?
Sometimes the metric you care about occurs rarely, such as a conversion event that happens for only 1 in 10,000 users. In that case, it may be very difficult to reach statistical significance in a typical timeframe, unless your traffic is huge. One approach is to lengthen the test. Another is to focus on a more frequent proxy metric that correlates with the main KPI. For instance, you might measure “added item to cart” if “purchased item” is too rare. Another approach is to expand the scope of your test to gather more data quickly. If the test is still infeasible, you might rely on offline or simulated approaches more heavily, but you lose some realism.
What are key real-world edge cases in A/B testing a new model?
One edge case is that your new model’s performance might degrade significantly for certain user subgroups, even if it does well on average. You discover this only if you slice data by user segments. Another edge case is user churn: if users strongly dislike your new model, they might abandon your platform, so any data you collect on them after that point is missing. This can lead to survivorship bias. You might also have trouble if the new model is prone to crash or error out on certain device types. Observing error rates across devices helps spot these issues. Realistically, you plan for unexpected issues and ensure that you can quickly revert to the old model if user experience is badly impacted.
Below are additional follow-up questions
How would you handle a scenario in which the new model could introduce bias into certain parts of the user population?
When running A/B tests involving complex machine learning models, one major challenge is unintentional biases creeping into the model’s outputs. This can have serious implications, especially if the product impacts protected groups (e.g., by gender, race, or age).
Ways to detect potential bias You can proactively monitor fairness metrics or segment your A/B test data by demographic attributes, if you have them in an ethically and legally compliant manner. For instance, if the new model is a recommendation engine, it might start favoring popular content from a particular subset of creators, inadvertently reducing visibility for others. You then compare performance (click-through rate, revenue, or engagement) across these user segments to ensure that your new model does not systematically harm or exclude any group.
Pitfalls If you only look at global metrics (like overall conversion rate) and ignore subgroup analysis, you might deploy a model that looks better on average but is detrimental to specific populations. This can harm brand reputation and create legal risks. Another subtle pitfall is that changes in user demographics over the duration of the test can mask bias. For example, if new users join the platform disproportionately in one variant, you might incorrectly conclude that the model itself is not biased when, in fact, it is the user sample that changed.
Mitigations One approach is to define fairness guardrail metrics, such as requiring that certain segments do not see a significant decline in utility or that the difference in outcomes between user groups remain below a certain threshold. If those guardrails are breached, the experiment is paused or reversed. Additional mitigations might include using specialized models or constraints (e.g., fairness-constrained optimization) before launching the A/B test.
What if the new model requires user feedback loops to fully optimize performance?
Some models (for example, recommendation systems or personalized ranking algorithms) rely on user interactions as feedback signals to refine their predictions. If you introduce a brand-new model that has not yet collected enough live user feedback, it might underperform initially, only catching up after it is exposed to user data for some time.
Design considerations You might run a staged rollout that allows the new model to gather sufficient feedback before comparing it head-to-head with the old model. In other words, you might let the new model train or fine-tune on a small fraction of live data for a few weeks, then begin the formal A/B test. Alternatively, you can measure performance in terms of how quickly the new model can adapt under partial traffic.
Pitfalls If the new system is starved of data because only a tiny fraction of traffic is directed to it, the model may not improve as fast as the old system, which continues to see the bulk of the traffic. This can create a self-fulfilling prophecy where the new model never gets enough feedback to match the old system. Another issue is that if the learning algorithm updates in real time, you must ensure versioning and experiment logging are consistent so you know precisely which variant’s parameters are used for each user.
How do you reconcile A/B testing results if the new model changes user behavior so profoundly that the old KPIs no longer capture the right signal?
Sometimes a new model or a new feature can fundamentally shift user behavior, making your existing metrics less reliable or less relevant. For example, if your new recommender algorithm leads users to discover novel content, they might stay longer in an application, but their purchase patterns might also change in unforeseen ways.
Approach You can introduce new metrics more aligned with the product’s evolving goals. For instance, if users are now interacting more frequently but in shorter sessions, you might measure session frequency in addition to session length. You might also track multi-day or multi-week retention metrics rather than focusing on daily metrics.
Pitfalls If you keep measuring only the legacy KPIs that were relevant to the old user flow, you could incorrectly conclude that the new model is failing, when it is simply optimizing for a different, possibly more valuable user experience. Another subtle issue is that the user funnel might change. For instance, if your new model helps users reach their goals faster, you might see lower dwell time but actually have higher overall user satisfaction.
How do you structure an experiment when the output of the new model is meant to be partially integrated with the old model?
In some scenarios, you do not fully replace the old model but rather combine it with the new model, for example, an ensemble approach or a hybrid strategy. This partial integration complicates the A/B test design because the user does not see purely the old model or purely the new model—they see some combination.
Experimental setup One idea is to define separate “blend ratios.” For instance, for Variant A (the control), you might keep the old model fully in control. For Variant B, you might incorporate the new model’s predictions with some weighting factor (like 30% new model, 70% old model). You then measure the performance difference between A and B. If B does better, you could run a subsequent test with a higher weighting for the new model (like 60/40) to see if you can further improve performance without degrading user experience.
Pitfalls If you do not carefully isolate the effect of the new model (for instance, if there are multiple confounding changes happening at once), you lose clarity in attributing improvements to the new model vs. other factors. Another pitfall is that partial integration might hide or dilute potential user dissatisfaction or technical issues that would appear if the new model were used alone.
What if you suspect that user geography or device type strongly influences the performance of the model, and you want separate A/B tests for each segment?
Sometimes the behavior of a system or the user population is so different across geographies or device types that you worry a single global A/B test will not capture the nuances. Alternatively, you might want to localize or customize the model by region or device.
Segmented design You can run multiple experiments in parallel, each restricted to a specific geography or device category. For instance, if you are testing new search ranking logic, you could run an A/B test only for users in the US on iOS devices, and a different test for users in Europe on Android devices. This ensures each experiment is more homogenous and might yield clearer results.
Pitfalls Running multiple concurrent experiments can reduce the statistical power in each segment, because you have fewer users in each bucket. There is also a risk of cross-experiment contamination if you do not design the user assignment carefully. Another subtle point is that if you discover the new model works great in one region but not another, you might want to do a partial rollout, which can be more complex operationally.
How would you handle an experiment in which the performance metric is extremely subjective (e.g., user happiness) and cannot be measured directly?
Sometimes you care about intangible outcomes, like user satisfaction, brand perception, or the delight factor. Direct quantitative metrics (like clicks or purchases) may not capture these subjective dimensions.
Possible solutions You can use proxy metrics: dwell time, user retention, or reduced churn might correlate with user happiness. You could also conduct surveys or user feedback forms, randomly assigned to a small fraction of users in each variant. You then compare survey responses between groups. Some teams run user experience labs or user interviews in parallel with the live A/B test to get qualitative insights.
Pitfalls Surveys can introduce sample bias (if only certain types of users respond), and self-reported measures might differ from actual behavior. Another subtlety is that measuring brand perception can take time—users might adapt to the new model only after extended usage. If your test is too short, you might not capture the longer-term shift in perceived satisfaction.
How do you handle a scenario where the new model works well only under high load or certain traffic patterns, and you want to test system scalability?
Some changes might be aimed at improving model performance under high load or stress conditions. For example, a new model might be more efficient computationally. However, if you do a 50/50 user split at average traffic levels, you will not see how the model handles peak load.
Load-focused approach You can run a controlled load test in parallel with the A/B test. For instance, artificially route more requests to the new model, or measure performance specifically during known peak hours. Another strategy is to run “burst tests” in which you scale up to certain load thresholds for short periods.
Pitfalls If you run a load test in a way that differs drastically from real user behavior, the metrics might be misleading. Additionally, if you direct artificially high load only to the new model, you might degrade its performance. Then you risk an apples-to-oranges comparison with the old model, which is not tested at the same load. Carefully interpret these results: is the difference due to the model itself or the disproportionate stress you put on it?
What if external factors (e.g., marketing campaigns, seasonal effects) coincide with the A/B test, making it hard to isolate the impact of the new model?
Real-world experiments rarely occur in a vacuum. Marketing campaigns, product promotions, or seasonality (e.g., holiday season for e-commerce) might alter user behavior at the same time you roll out the new model.
Strategies to isolate effects One option is to delay major campaigns or other large changes until after the test. If that is not feasible, you can at least ensure that both variants experience the same external influences by randomizing at the correct granularity. For instance, if you launch a marketing campaign globally, ensure the traffic split remains consistent. You might also analyze the data before, during, and after the campaign period to see if the difference in performance remains stable.
Pitfalls If the marketing campaign disproportionately drives new users who are assigned to the new variant, that could inflate metrics for the new model. Similarly, if the seasonality effect leads to higher user engagement overall, the difference between the variants might shrink or become amplified in ways that do not generalize to normal periods. Another subtlety is that user behavior might be permanently changed after the campaign ends, so you need to run the test for enough time to see if your model’s advantage persists.
How do you interpret your A/B test if the new model significantly increases short-term revenue but might cause user fatigue over the long term?
Certain changes, especially in ads or monetization, can boost short-term revenue. However, if you push too many ads or aggressively optimize for immediate conversions, you can burn user goodwill, leading to increased churn in the long run.
Longitudinal measurement One approach is to look at user engagement over a longer window, such as 30 or 60 days. You can also measure user sentiment or churn metrics in addition to short-term revenue. Some companies define a forward-looking metric like 30-day retention or cumulative revenue from the user’s perspective.
Pitfalls If you rely solely on a short test period, you might celebrate an immediate revenue jump but miss the negative effects that will materialize only weeks or months later. Another issue is that if your product sees occasional users, you must track them for longer to observe the full impact. If you see that the new model significantly outperforms the old one in the short term, but you lack data on longer-term user behavior, you might want to do a phased approach, leaving the new model in place for specific cohorts and continuing to measure them over time.
How would you approach determining whether an A/B test is safe to expand to a larger percentage of traffic or to end early if the new model is clearly inferior?
During the early stages of an A/B test, you might see strong indications that the new model is significantly underperforming. Alternatively, it might be dramatically outperforming the old model, suggesting a benefit to ramping up faster.
Adaptive experiment monitoring One best practice is to define interim checks or adopt sequential testing methods. In sequential testing, you monitor the performance difference at certain intervals with prespecified stopping criteria. For instance, if the new model’s KPI is consistently worse by a large margin or if the p-value remains extremely high for a beneficial difference, you can safely stop early to prevent ongoing negative impact or wasted time. Conversely, if the new model is strongly outperforming the old model beyond a certain threshold, you can ramp traffic up sooner.
Pitfalls A major issue is p-hacking or inflated false positives from repeated looks at the data. Without adjusting your significance thresholds for interim looks, you risk making decisions prematurely. Another subtlety is that performance might fluctuate over time (e.g., day-of-week or user learning curve). You do not want to freeze a test too soon based on ephemeral signals.
How do you handle an environment where your new model is part of a larger pipeline that includes subsequent machine learning components downstream?
In real-world production systems, your model might be just one stage of a multi-stage pipeline. If you change the first stage (e.g., a feature extraction or ranking model), it can shift the input distribution for the subsequent stages.
Coordinated experimentation You might either keep all downstream components the same while only swapping in the new first-stage model for some users or run a versioned pipeline for the new model in parallel so you test end-to-end performance. Logging is crucial: you must ensure that the inputs and outputs at each pipeline stage are recorded, so you can see whether the downstream model is receiving unexpected data distributions.
Pitfalls If the downstream models are not retrained or adapted to the new distribution, they might degrade in performance, which can overshadow the improvements from your new first-stage model. Another challenge is that debugging an underperforming pipeline becomes harder when multiple models are involved. You might need a specialized methodology to isolate the source of performance differences.
How do you manage a scenario where the new model must be partially trained on a real-time streaming architecture, and you also want to do an A/B test?
Some products rely on continuous data ingestion (e.g., a recommendation system for a live feed). The new model might be trained or updated in near real-time, making it tricky to isolate a stable version of the model for the duration of the A/B test.
Stream-based approach You could “fork” your data stream: one fork is used to update the old model, and the other is used to update the new model. Each user is still consistently bucketed into one variant. Over time, the old model evolves with its subset, and the new model evolves with its subset. The A/B test continues until you have enough observations to compare.
Pitfalls If the new model sees significantly different data distributions than the old model because of random chance or user segmentation, that can confound the results. Another subtlety is that real-time training might have stateful dependencies, so you must ensure that the model states are not accidentally shared or leaked between variants.
How do you handle a scenario where organizational policy demands a maximum time limit for user exposure to a non-optimal model?
Some organizations are particularly cautious about user experience or have legal obligations to provide users with the “best” version of a product. They might require that any user sees a subpar model for only a short timeframe.
Forced short tests In such cases, you might do a short run with a small fraction of traffic. If the new model does not show strong improvements, you revert quickly. If the model does show promise, you can expand incrementally. You can also rely more heavily on offline validation to filter out obviously weaker models before an online test.
Pitfalls A short time window might fail to capture the model’s true performance, especially if user behavior has a delayed response or if the model needs more data to stabilize. Another subtlety is that if you only ever test with a small fraction of traffic and for short durations, you might repeatedly fail to find a meaningful difference due to insufficient statistical power.
How do you plan and budget for computational costs during an A/B test if the new model requires specialized hardware?
The new model might demand GPU acceleration, large amounts of memory, or other costly resources that the old model does not. This raises questions about the feasibility of scaling the new model if it proves better.
Resource planning One approach is to run a limited-traffic test, carefully measure the operational cost for the new model at that scale, and extrapolate to the full user base. If the new model becomes the permanent solution, you need to ensure that you can procure enough resources to handle production load. You also have to track cost metrics as part of the test’s KPI (cost per inference, total hardware usage, etc.).
Pitfalls If you do not factor in scaling costs, you might find that the new model, while performing better, is financially prohibitive at large scale. Another subtlety is that GPU or specialized hardware usage might have performance bottlenecks during peak times that you do not observe at smaller scale. This can lead to an overly optimistic interpretation of test results.
How can you ensure data privacy and compliance during the A/B test, especially if the new model needs sensitive user data?
For certain products, the new model might rely on more user data or sensitive attributes (like location, personal preferences, or payment information). Ensuring compliance with GDPR, CCPA, or other data protection regulations is critical.
Privacy-focused approach You can set up the new model so that any sensitive data is either anonymized or aggregated before being passed to the model. You can also ensure secure logging to avoid storing personal details. If a user opts out of data collection, your experiment design must honor that.
Pitfalls If you collect additional user data for the new model variant, but not for the old model variant, you must handle that carefully to avoid any bias in randomization (i.e., not only do you have a difference in the model, but also in the data you collect for each user). Another subtlety is that some jurisdictions might require explicit user consent for being part of an experiment that uses sensitive data.
How do you handle real-time user feedback that might cause you to pivot the experiment mid-way?
Sometimes you release a new model to a fraction of users, and you receive direct complaints or negative app store reviews. This user feedback could prompt you to modify the experiment or revert the change before gathering enough statistical evidence.
User-driven iteration One approach is to treat critical user feedback as a high-priority signal. You might temporarily disable the new model or reduce its traffic allocation while you investigate or fix the issues. If you fix the model, you would typically restart or re-run the test to gather fresh data.
Pitfalls By halting the test prematurely, you lose the ability to see whether the complaint was widespread or just a small fraction of vocal users. Another subtlety is that if you fix the model mid-test, you confound the original results. The “new model” that later users see is not the same as the “new model” that the first users saw, so the aggregated data across the entire test period may be invalid.
How do you interpret conflicting evidence from multiple metrics, such as when the new model shows improved predictive accuracy but fails to increase user engagement?
It is not unusual for a new machine learning model to show better offline metrics or better raw predictive scores but not translate those gains into higher engagement or user satisfaction.
Deep analysis You can segment your user interactions to see where the discrepancy arises. Is the new model delivering more accurate recommendations, but possibly too similar or lacking variety (leading to boredom)? Are there UI changes that hamper discoverability? The difference might not be about model accuracy but about user-perceived novelty or trust.
Pitfalls If you prioritize one metric (e.g., F1 score) over user engagement, you might ignore important contextual factors. Another subtlety is that improvements in accuracy could lead to minimal or even negative business impact if the metric you optimized does not align well with real user preferences. You might need to refine your labeling or objective function to match business goals more directly.
How do you handle the situation where the observed effect in the A/B test is highly volatile, with day-to-day swings in the performance difference?
Sometimes key metrics vary wildly from day to day, making it difficult to conclude whether the new model is genuinely better.
Variance control You can consider smoothing techniques, such as looking at a rolling average over several days. You might also break out your traffic by time-of-day or day-of-week patterns, analyzing each slice. If the variation is still high, you might need a bigger sample size or a longer test duration to see a clear trend.
Pitfalls If you prematurely declare success on a day that looks great, you might be ignoring negative days. Similarly, if you look at daily swings without controlling for seasonal or cyclical patterns, you could overreact. Another subtlety is that users themselves might have spiky behavior (for example, big sporting events can drive unusual traffic), so you must ensure your test runs over a sufficiently representative window of normal usage.
How do you track real-time anomalies and ensure that the new model does not cause a sudden spike in errors or latencies during the test?
When rolling out new models, you can face unexpected errors, data format mismatches, or performance bottlenecks that degrade user experience in real time.
Observability Set up automated alerting on error rates, latency distribution, memory usage, and CPU/GPU usage. If an anomaly is detected, you can automatically stop sending traffic to the new model or at least cap its traffic portion. Another approach is to have a canary deployment that receives a small fraction of traffic and is monitored for anomalies before the main A/B test starts.
Pitfalls If your alerts are too sensitive, they could trigger frequent halts of the experiment for minor fluctuations, thereby making it impossible to gather stable data. Conversely, if your alerts are too lenient, you might not catch subtle but compounding issues that degrade performance over time. Another subtlety is that errors might appear only under specific user scenarios that you did not test offline, so your logs must be detailed enough to diagnose root causes.
How would you deal with a complex interplay between the new model and user incentives or gamification features?
In systems that involve gamification (like awarding badges, points, or status for certain activities), changing the model that surfaces content or items can shift how users engage to earn those rewards.
Behavioral analysis You might measure the distribution of user activities that earn rewards before and after launching the new model. If you see that certain game-like features are exploited more in the new variant, that might artificially inflate some engagement metrics. You could also measure the time or effort needed to reach a reward threshold to see if the model inadvertently reduces or increases difficulty.
Pitfalls If your new model unintentionally skews the path to reward attainment, you could create an unfair or unbalanced experience for the A/B test participants. Users might become frustrated, leading to churn. Another subtlety is that if the new model is too effective at guiding users toward easy rewards, you might see short-term spikes in engagement that do not necessarily translate to long-term retention.
How do you manage a situation in which your new model requires a completely different user interface, so you cannot isolate the model change from the UI change in the same test?
Sometimes the new model’s outputs (e.g., new recommendations or personalization) must be displayed in a redesigned UI. This lumps together a model change and a UX change, making it difficult to attribute which part is responsible for improved or worsened metrics.
Layered experiments One strategy is to first run a UI-only test that uses the old model but a new UI. Then you run a second test comparing the old model vs. new model while holding the UI constant (if possible). Finally, you can combine them to see the additive effect. If that is not feasible, you accept that your A/B test is measuring the combined effect of a model and UI redesign.
Pitfalls Running layered experiments requires more time and more user cohorts. Overlapping or sequential changes can lead to user confusion. Another subtlety is that some UIs only make sense with the new model’s outputs, in which case you cannot easily separate them. You then end up with a single combined test that lumps model improvements with UI changes, risking a blind spot about which component truly drove the outcome.
How would you address the possibility of user displacement, where the new model might cannibalize metrics in one area while boosting them in another?
A typical example is in an e-commerce or streaming platform where the new model boosts consumption of certain items, but causes less consumption of others—leading to a shift rather than a pure net gain in overall engagement.
Holistic KPI tracking Track multiple levels of metrics, including category-level consumption. This reveals whether the new model simply reallocated user attention from one set of items to another without changing total revenue or dwell time. If you see overall engagement is flat but certain items are promoted more, you might evaluate whether that is acceptable or beneficial from a strategic perspective.
Pitfalls If you only track a top-level metric (like total sales) and fail to see changes in distribution (like brand A’s sales go up while brand B’s sales go down), you might overlook crucial partner relationships or marketplace balance. Another subtlety is that the new distribution might have longer-term consequences—some vendors might leave if their sales drop, or certain content creators might lose interest.
How do you handle scenarios where you are testing multiple new models at once, each with small user cohorts (e.g., multi-armed bandit approaches)?
Instead of a classic two-variant A/B test, some organizations experiment with multi-armed bandits where multiple variants compete. Over time, traffic is shifted automatically to the variant performing best.
Adaptive strategy You can treat each model variant as a different “arm.” The system tracks reward metrics (like click-through rate) and uses an algorithm (like Thompson Sampling or Upper Confidence Bound) to allocate traffic proportionally to the best-performing arm.
Pitfalls While bandits reduce the regret of exposing users to suboptimal variants, they can complicate the analysis of final results. Standard methods for computing confidence intervals or significance might not directly apply because the traffic assignment is not static or purely random. Another subtlety is that if the difference between arms is small, the bandit algorithm might not converge in a timely manner, or it might over-commit to an early winner if the initial performance differences are exaggerated by chance.
How do you handle the real-world complexity where the success of the new model might depend on user context that is not captured in your logging?
Some products have offline or external factors—like a user’s mood, environment, or social context—that you do not log. If the new model’s performance depends heavily on these unobserved factors, your A/B test data might be incomplete.
Context enrichment One approach is to gather additional context signals (with user consent) that might help interpret differences in performance. Alternatively, you can design user surveys or questionnaires to glean partial insight into the user’s context at the time of interaction.
Pitfalls Over-collecting data can raise privacy concerns and overhead. Another subtlety is that if you only gather contextual data for a small subset of users, that subset might not be representative. This means your analysis could still be confounded by unmeasured factors in the broader user population.
How would you approach migrating the entire user base if the new model’s advantage is only valid for a specific subset of traffic?
It is possible that the new model is measurably better for a particular user group (like experienced users) but not for newcomers. Or it may excel in one product category but be mediocre in another.
Targeted rollout You might do a partial adoption strategy, deploying the new model only for the segment where you know it performs better. Meanwhile, the old model remains in place for other segments. Over time, you can refine the new model to handle the other segments.
Pitfalls Maintaining two separate models in production can increase operational complexity. Another subtlety is the risk of confusion if users switch from one segment to another (e.g., a user once considered a “newcomer” eventually transitions into an “experienced” category). You need a robust logic for moving users from the old to the new model if it becomes beneficial.
How do you confirm that the data pipeline feeding the new model is identical in quality to the old model’s data pipeline?
Some model updates also come with changes to data preprocessing or feature engineering. If the pipeline transformations differ, you need to ensure you have not inadvertently introduced data leakage or misalignment.
Data validation You can run automated checks to confirm that the features going into each model align with expectations. For example, if the new model expects normalized numeric features, but the old model used raw values, an inconsistency in the pipeline can yield misleading results.
Pitfalls If the new pipeline has a bug that only appears in production but not in offline tests (e.g., a mismatch in the order of operations or a time-lag issue), you might incorrectly blame the model for poor results. Another subtlety is that a difference in the frequency of pipeline updates (e.g., the old model sees daily updates while the new model is updated hourly) could skew comparisons if you are not aware of the difference.
How might you leverage advanced causal inference techniques rather than a simple randomized A/B test?
In certain situations, you cannot perform a fully randomized experiment or must rely on observational data. You might explore causal inference methods like instrumental variables or difference-in-differences.
Causal inference perspective If randomization is partial or compromised, you can attempt to correct for selection bias with propensity score matching or inverse probability weighting. If you have a known external instrument that influences model exposure but does not directly affect outcomes, you can isolate causal effects.
Pitfalls These techniques require strong assumptions (e.g., stable unit treatment value assumption, no unmeasured confounders), which might be unrealistic in messy production environments. Another subtlety is that the interpretability of these methods can be more challenging. If you do not thoroughly validate the assumptions, you risk drawing incorrect conclusions about causality.
How do you handle potential synergy or interference effects between two new models deployed in different parts of your product?
Consider a scenario: you have a new recommendation model for your home page and a new ranking model for your search results. Each is tested in separate A/B experiments, but users might interact with both the home page and search.
Synergy analysis One method is to cross the experiments in a factorial design. That means you have four variants: (1) old home & old search, (2) new home & old search, (3) old home & new search, (4) new home & new search. By comparing all four conditions, you can see if the combination yields synergy or if it neutralizes each other’s gains.
Pitfalls Factorial designs can be more expensive, because you subdivide traffic into more cells. Another subtlety is that if one test strongly benefits from the presence of the other model, you might incorrectly conclude that the individual effect of that model is minimal if you do not analyze the combined and separate effects carefully.
How would you address the risk that, after your A/B test, user behavior patterns in the future might differ substantially (e.g., due to external events), causing the deployed model to underperform?
A typical real-world challenge is that user behavior shifts over time (due to seasonality, macroeconomic changes, product trends, etc.). Even if you see a positive result during the test, the advantage might not hold later.
Ongoing monitoring After deploying the new model, keep tracking key metrics. If they start to drift or degrade, you can run a new experiment or revert. You might also store data for retraining if your model is designed to adapt. In high-volatility domains, frequent re-validation (or continuous online learning) is often necessary.
Pitfalls If you rely solely on the A/B test and do not track post-deployment performance, you could miss a sudden shift. Another subtlety is that if you keep re-running experiments too often, you risk introducing user confusion or friction. Balancing the need for agility with the stability of user experience can be challenging.
How do you handle post-launch user perceptions if the new model results in negative PR or controversies, even if the metrics improved?
Sometimes a new model drives good metrics but triggers user backlash for reasons like privacy concerns, user frustration with transparency, or ethical questions.
Reputation considerations You might include user sentiment monitoring in your experiment framework. Social media mentions, user reviews, or direct feedback can be tracked to detect negative public perceptions early. Even if your internal metrics look positive, a mounting PR issue might force a rollback.
Pitfalls Focusing solely on short-term numeric metrics can blind you to reputational harm. Another subtlety is that once a negative story spreads, reversing or apologizing later might not undo the damage. Thus, you might adopt a more cautious approach, or communicate clearly about the purpose and benefits of the new model before or during the test.