
ML Interview Q Series: Assessing Phone Number Pattern Randomness with Binomial Probability.

Browse all the Probability Interview Questions here.
Suppose you have 150 friends, and you discover that exactly three of them have phone numbers ending in some permutation of the digits 0, 1, 4, and 9. Is this just a random coincidence, or is there a justification behind it? Explain your reasoning.
Short Compact solution
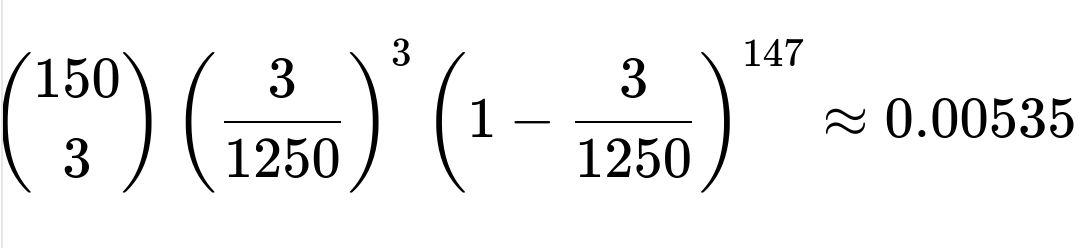
We can treat each phone number’s final four digits as one of 10,000 equally likely combinations (digits 0–9 for each of the four positions). There are 4! = 24 ways to arrange the digits 0, 1, 4, and 9, so the probability that any single phone number ends in a permutation of these four digits is 4!/10000 = 24/10000 = 3/1250. Given 150 friends, the probability that exactly three of them have this special pattern in their last four digits follows a binomial distribution. Thus, it is

meaning the likelihood is a bit over half a percent, which is quite small. Therefore, seeing precisely three such numbers out of 150 is unlikely if phone numbers are uniformly random.
Comprehensive Explanation
Probability Setup
When each phone number is considered to have uniformly distributed last four digits (i.e., each of the 10,000 possible four-digit endings is equally likely), the probability that the four digits are a particular permutation of {0, 1, 4, 9} is computed as follows:
There are 10 possible digits (0 through 9) for each of the 4 positions, so there are 10⁴ = 10,000 equally likely 4-digit endings.
The number of distinct permutations of the specific digits {0, 1, 4, 9} is 4! = 24.
Hence, the probability for any one phone number to end in a permutation of {0, 1, 4, 9} is 24/10000 = 3/1250.
Binomial Distribution Explanation
When you have a set of 150 independent “trials” (in this case, each friend’s phone number is one trial where “success” is having the last four digits be a permutation of {0, 1, 4, 9}), and the probability of success per trial is p = 3/1250, the distribution that governs the total number of successes is the binomial distribution.
The binomial probability mass function for exactly k successes out of n trials is:

where:
ParseError: KaTeX parse error: Can't use function '$' in math mode at position 13: \binom{n}{k}$̲$ is the binomi…
ParseError: KaTeX parse error: Can't use function '$' in math mode at position 2: n$̲$ is the total …
This value, about 0.53%, indicates it would occur roughly 1 out of 188 times on average if you repeated this situation under perfectly random conditions.
Conclusion on Randomness
Given the computed probability is indeed below 1%, one might conclude that seeing exactly three such phone numbers in a group of 150 is a relatively rare event, though still plausible. The question “Is this just a chance occurrence?” can be thought of in two ways:
Under purely random uniform assumptions, the event is improbable (slightly more than 0.5%).
In real life, phone numbers might not be perfectly random, and certain digits might appear more or less often, so there could be other explanations if we see this too frequently or infrequently compared to the binomial model.
Nevertheless, on the face of it, purely using a uniform model of digits suggests that having three friends with those special digits is possible but not very common.
Potential Follow-Up Questions
Why can we model the problem with a binomial distribution?
In this problem, each friend’s phone number can be viewed as an independent trial with two outcomes: either the last four digits are a permutation of {0, 1, 4, 9} (success) or not (failure). The probability of success remains the same (3/1250) for each friend under the assumption of uniformity. Independence and a constant probability of success justify using a binomial distribution.
Deeper considerations:
If there is dependence among phone numbers (e.g., if two friends from the same region might have similar last four digits for some reason), this assumption may be violated.
If we have reason to believe that phone numbers are not uniformly distributed (for instance, certain patterns are more likely in real phone systems), then the binomial assumption might need adjustment.
What if leading zeros or certain digit patterns are restricted in phone numbers?
Some phone systems avoid certain leading digits in certain contexts. If, for instance, the first digit in the four-digit sequence cannot be 0, the probability p would change significantly. The total number of valid 4-digit endings might not be 10,000 anymore.
Adjustments:
You would need to count how many of the permutations of {0,1,4,9} meet the phone system’s constraints (e.g., if leading zero is disallowed, then only permutations starting with 1, 4, or 9 are valid).
You would similarly adjust the total possible last-four-digit combinations based on phone system constraints.
Could phone number distributions deviate from being uniform?
Yes. In reality, not every 4-digit sequence is equally likely to appear as a phone number suffix. Some telecom regulations or historical numbering plans might bias certain ranges or patterns. If you suspect a non-uniform distribution, the simple assumption p = 3/1250 no longer holds, and you would need empirical data or a more domain-specific model to calculate the probability.
Example:
Some exchanges or special numbers might appear more frequently (like vanity numbers).
Certain digits might be reserved for internal uses or special services.
If the probability is only around 0.5%, does that mean it cannot happen?
Not at all. A roughly 0.5% chance is small, but far from impossible. Rare events happen by chance. A 0.5% event translates to seeing it occur once on average every 200 or so cases. Therefore, concluding that it must be more than chance without further evidence is not justified. Statistics typically would require an event with much smaller probability or repeated “unusual” outcomes to consider it highly suspicious or requiring deeper non-random explanations.
How would you verify this in a real-world dataset of phone numbers?
If you had actual phone number data, you could do an empirical check:
Count how many phone numbers actually end with these permutations.
Compare the observed frequency with the theoretical frequency under uniform assumptions (p = 3/1250).
Perform a statistical test (e.g., chi-squared test or binomial test) to see if the difference is statistically significant.
Could we apply a Poisson approximation here?
When dealing with large n (number of friends) and small p (small probability of an event), one might approximate the binomial distribution with a Poisson distribution, where the mean


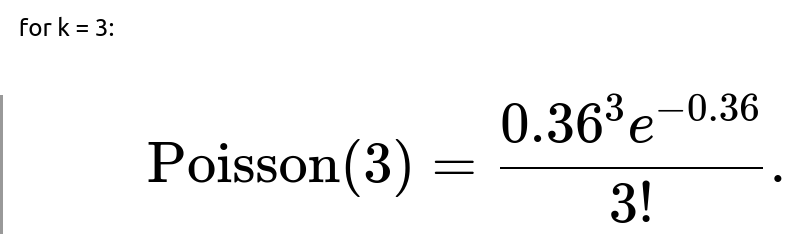
You would get a probability that should be close to (but typically not exactly the same as) the binomial result. This is often used as a simpler calculation for large n, small p scenarios, though in an interview you would typically note it as an alternative or a check.
Real-World Pitfalls and Edge Cases
Phone Number Formatting If phone numbers vary internationally, the assumption of 4-digit uniform suffixes might fail. Some places might not use 4-digit patterns at all.
Data Quality If the data on phone numbers is incorrectly recorded or truncated, probability estimates could be off.
Multiple Counting If some friends share the same phone plan or number (not typical, but possible in certain contexts), the independence assumption is broken.
Below are additional follow-up questions
How might you handle the situation if you were interested in the probability of having three or more such phone numbers, rather than exactly three?
One might want the probability of having at least three friends whose last four digits match any permutation of {0,1,4,9}. In that case, you would sum binomial probabilities for k = 3, 4, 5, …, up to 150. Symbolically, you would compute

This sum captures every outcome where three or more friends match the pattern. In practical terms, you could use a statistical or numerical library to compute this directly, or approximate it with 1 minus the probabilities of k = 0, 1, or 2.
Pitfalls may include numerical precision issues if you sum many small binomial terms. In software, using specialized functions that handle cumulative distribution calculations is safer. Another subtlety is the interpretation of “three or more” as a single event threshold (like a “rare event alert”), which might warrant a different approach, such as controlling a Type I error if you are repeatedly scanning for anomalies.
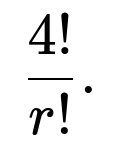
What if the digit set was not limited to distinct digits, for instance if the chosen digits could repeat (e.g., 0, 1, 1, 9)? How would that change the probability?
When digits can repeat, you must re-count the possible four-digit endings that include the chosen digit set with the specified multiplicities. For example, if you consider the exact multiset {0, 1, 1, 9}, the total permutations differ from 4! because there is a repeated digit. Generally, for a multiset of 4 digits that includes r repeated digits, the number of unique permutations becomes
Additionally, you need to confirm how many ways there are in the broader universe of all four-digit endings that can match that repeated pattern. If multiple patterns are allowed (e.g., any repeated-digit arrangement), the total probability will be a sum of probabilities over each valid arrangement.
A subtle real-world issue is that phone systems might treat repeated digits differently (or certain repeated-digit numbers might be vanity numbers or restricted). Thus, the naive counting approach might over- or under-estimate actual occurrences if those constraints exist.
Could outliers in your data (for instance, phone numbers not conforming to the usual 4-digit suffix format) affect the probability estimation?
Yes. If some phone numbers do not follow the standard “four digits at the end” pattern, they might invalidate the assumption that each friend’s phone number is drawn from the same distribution of 10,000 possibilities. Examples could include older or foreign phone systems that have fewer or more digits, or an ID-based system rather than purely numeric.
In those cases, you would likely exclude or treat those outliers separately. Including them in the same calculation could misrepresent the true probability. One subtlety is deciding how many outliers are significant enough to distort your probabilities: a small number might not have much effect, but a large fraction of non-conforming numbers would definitely require rethinking the approach.
How might a Bayesian approach differ from the purely frequentist binomial framework?
A Bayesian approach would start by assigning a prior distribution to p, the probability that a given phone number ends in the special 4-digit permutation. Instead of asserting p = 3/1250 outright, you might specify a Beta prior that reflects your uncertainty about p. Observing that 3 out of 150 people match the pattern then updates the posterior distribution of p via Bayes’ rule.
One subtlety is choosing a meaningful prior. If you strongly believe phone numbers are close to uniform, your prior would peak around 3/1250 but still allow for some variation. After observing data, you would get a posterior distribution for p, which might shift slightly if the observed data deviates from your prior expectation. A potential pitfall is that if the prior is overly restrictive or poorly chosen, you might draw misleading conclusions.
Could you use a confidence or credibility interval to describe uncertainty around the observed proportion?
Yes. With 3 successes out of 150, you can construct a confidence interval (frequentist) or a credibility interval (Bayesian) for the underlying probability p. For the frequentist approach, you might use the Wilson score interval or an exact binomial interval. For a Bayesian approach, you might use a Beta posterior and quote a highest posterior density interval.
A key subtlety arises if 3/150 does not meet normal approximation criteria (for instance, if p is quite small). Then using standard normal approximation might yield incorrect intervals. Also, if phone numbers are not actually independent or identically distributed, the intervals would be misleadingly narrow, and you might need a more careful approach (for example, using hierarchical models if you suspect phone numbers vary by region).
What if you discover the telecom system changes each month, rendering the uniform assumption invalid across different times?
If phone numbers are issued under different rules at different times, combining them into a single group of 150 might invalidate a single binomial distribution assumption. Instead, you might break your data into subsets (e.g., phone numbers obtained before a certain year vs. after) and assess each subset’s probability of matching the pattern.
You could model the overall probability as a mixture of binomials, each with its own success probability. A potential pitfall is ignoring time-based changes altogether, which might incorrectly attribute a series of hits (or misses) to random chance rather than evolving distribution rules.
What if sampling bias in how you collected your data leads to over-representation of certain patterns?
Suppose you have a higher proportion of friends from a certain geographic region or with certain phone plans. This bias could lead to systematically higher or lower chances of those specific digits appearing in the last four digits. In statistical terms, the assumption that each friend’s phone number is an independent draw from the same distribution fails.
One way to handle this is to stratify your sample: look at subsets of phone numbers based on geography or phone plan type. You would then apply the binomial probability to each stratum separately, or incorporate weighting if you know the proportions of each subgroup in the overall population. A subtlety is that sometimes you might not realize you have sampling bias, leading you to misinterpret results as random fluctuations rather than an unrepresentative sample.
Could the length of the phone number (beyond the four-digit suffix) matter for probability modeling?
Yes. In some countries or systems, phone numbers might have variable lengths, and the “last four digits” might not always align with the typical notion of a “universal suffix.” For example, certain short-code or specialized lines may have fewer than four terminal digits.
If you included these special numbers in your dataset without accounting for the missing or nonstandard digits, your probability estimate for the “special 4-digit pattern” might be off. You might either exclude those numbers or standardize how you interpret the “last four digits.” The subtlety is recognizing that phone number formats can be quite diverse, especially in an international setting, and inadvertently lumping them together in a single distribution can produce misleading inferences.