
ML Interview Q Series: Calculating Human Height Probabilities Using Normal Distribution and Z-scores.

Browse all the Probability Interview Questions here.
The height of a randomly selected man from a population is normal with mean 178 cm and standard deviation 8 cm. What proportion of men are taller than 185 cm? There are 2.54 cm in an inch. How do we express their height distribution in inches? The heights of women in this population are normal with mean 165 cm and standard deviation 7 cm. What proportion of the women are taller than half of the men?
Short Compact solution
Let M denote the height of a man in centimeters. We want P(M > 185). This is P((M - 178)/8 > (185 - 178)/8). Since (185 - 178)/8 = 7/8, we get P(Z > 0.875) for a standard normal Z, which is approximately 0.19, or 19%. If H is the height of a man in inches, then H = M / 2.54, so H is N(70.1, 3.15²). For the women, let W be the height in centimeters. The probability that a randomly selected woman has height greater than 178 cm is P((W - 165)/7 > (178 - 165)/7) = P(Z > 13/7) = 0.032. Hence about 3.2% of the women are taller than half of the men.
Comprehensive Explanation
Understanding the distribution for men:
Men’s heights are modeled as a normal random variable M with mean 178 cm and standard deviation 8 cm. The question asks first: “What proportion of men exceed 185 cm?”
We rewrite 185 cm in terms of the standardized variable Z = (M - mean) / std, which is (M - 178) / 8. Then:
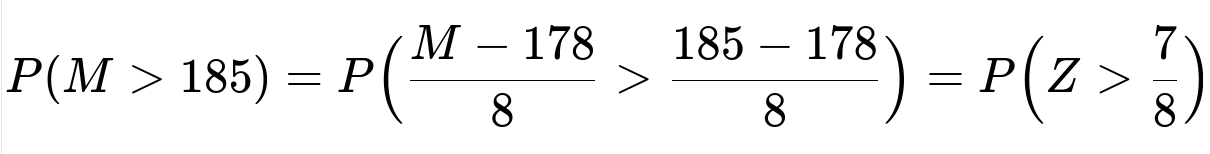
Here Z ~ N(0,1). Using standard normal tables or a software package, P(Z > 0.875) is approximately 0.19. Thus around 19% of men in this population are taller than 185 cm.
Converting men’s height distribution from centimeters to inches:
There are 2.54 cm in 1 inch. Therefore, to convert the random variable M (men’s height in cm) to H (men’s height in inches), we use H = M/2.54.
Since M ~ Normal(178, 8²), scaling by a constant factor 1/2.54 means H has mean 178/2.54 and standard deviation 8/2.54. Numerically, 178/2.54 ≈ 70.1 inches, and 8/2.54 ≈ 3.15 inches. Hence H ~ Normal(70.1, 3.15²).
Understanding the distribution for women:
Women’s heights W are modeled as a normal random variable with mean 165 cm and standard deviation 7 cm. The question: “What proportion of the women are taller than half the men?” can be interpreted several ways, but from the short solution we see they determined the threshold 178 cm (which is the median of men’s distribution). Since a normal distribution is symmetric around its mean (and here we approximate the median by the mean for simplicity, or we note that half the men are below 178 cm if 178 is taken as a central point), the question becomes: “What percentage of women exceed 178 cm?”
Hence we compute:

Again Z ~ N(0,1). Numerically 13/7 is about 1.857. Looking up in a standard normal table or using statistical software, P(Z > 1.857) ≈ 0.032. That corresponds to 3.2%. So around 3.2% of the women in this population are taller than the central cutoff point of men’s heights (roughly 178 cm), which is consistent with the statement “taller than half the men.”
Potential Follow-Up Questions
What is the probability density function (pdf) of a normal distribution?
One might ask to recall the general form of the normal pdf, since we keep using it implicitly. The probability density function of a normal random variable X with mean mu and standard deviation sigma is given by:

Parameters: x is the variable of interest (e.g. the height), mu is the mean, sigma is the standard deviation, and pi and e are mathematical constants approximately 3.14159… and 2.71828… respectively.
How might we compute these probabilities in Python?
We can use libraries like scipy.stats. For example:
import numpy as np
from scipy.stats import norm

# Probability that a normal(178, 8^2) random variable exceeds 185
prob_men_over_185 = 1 - norm.cdf((185 - 178)/8)
print(prob_men_over_185)

# Probability that a normal(165, 7^2) random variable exceeds 178
prob_women_over_178 = 1 - norm.cdf((178 - 165)/7)
print(prob_women_over_178)
This confirms the same numeric results ~0.19 for men over 185 cm, and ~0.032 for women over 178 cm.
Why is normality a good assumption for human heights, and are there any real-world deviations?
In many populations, adult height is well-modeled by the normal distribution due to the Central Limit Theorem acting on multiple genetic and environmental factors. However, in practice, extremely tall outliers or certain specialized sub-populations might not adhere perfectly to a normal distribution. Additionally, in smaller samples or certain demographic groups, the data might exhibit mild skewness.
What if we wanted the proportion of women who exceed 50% or 75% or 90% of men?
We can see that "taller than half the men" is effectively "taller than the median male height." If we wanted “taller than 75% of men,” we would calculate the male height at the 75th percentile, then find the probability that a woman’s height is above that percentile. Concretely, if Q is the 75th percentile of M’s distribution, we find Q = 178 + z * 8, where z is approximately 0.674 (the value at which P(Z < 0.674) = 0.75). Then we compute P(W > Q) similarly with the women’s normal distribution.
How to handle a scenario where the male distribution or female distribution is not normal?
In real data scenarios, if the assumption of normality fails, we might turn to non-parametric methods or transform the data. Alternatively, we might use distributions that can model heavier tails or asymmetries. However, for the majority of standard analyses of adult heights, the normal distribution remains a strong practical fit.
How are these probability values useful in real data science or machine learning contexts?
Calculating such probabilities is important in many areas:
Setting threshold-based criteria in certain biometric or manufacturing processes (e.g., sizing clothing).
Defining outlier thresholds in anomaly detection systems.
Modeling continuous variables for generative or discriminative models in ML pipelines.
These follow-ups reflect deeper knowledge of both statistical theory and real-world applications, which might be probed in a rigorous data science or machine learning interview.