
ML Interview Q Series: Calculating Full Bus Stop Coverage Probability using Inclusion-Exclusion.

Browse all the Probability Interview Questions here.
QuestionAn airport bus deposits 25 passengers at 7 stops. Each passenger is equally likely to choose any of the 7 stops and acts independently of the others. The bus only makes a stop if at least one passenger wants to get off there. What is the probability that at least one passenger gets off at each of the 7 stops?
Short Compact solution
Define A_i as the event that no passenger gets off at stop i. Then the probability we seek is 1 - P(A_1 ∪ A_2 ∪ … ∪ A_7). The probability that no passenger gets off at exactly k of the 7 stops is ((7 - k)^25) / (7^25). By the inclusion-exclusion principle:
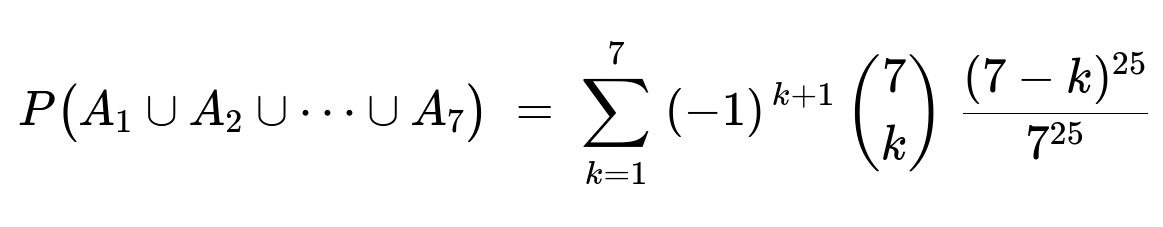
Numerically, this sum is 0.1438. Thus, the desired probability (that every stop has at least one passenger getting off) is 1 − 0.1438 = 0.8562.
Comprehensive Explanation
Setup of the problem
We have 25 passengers who each independently and uniformly choose one of 7 stops to get off. Hence each passenger has a 1/7 chance of choosing any particular stop, and the total number of ways all passengers could distribute themselves among these 7 stops is 7^25 (since each passenger has 7 choices, and there are 25 independent passengers).
We want the probability that every one of the 7 stops has at least one passenger. In probability terms, define A_i as the event that the i-th stop is empty (i.e., no passenger chooses it). The probability of A_i is (6^25)/(7^25), because if nobody gets off at stop i, each passenger must choose from the remaining 6 stops.
However, simply summing P(A_i) over i=1..7 would overcount scenarios in which multiple stops are empty. Therefore, we use the principle of inclusion-exclusion to handle overlaps.
Inclusion-exclusion principle
The principle of inclusion-exclusion for 7 events A_1, A_2, …, A_7 states:
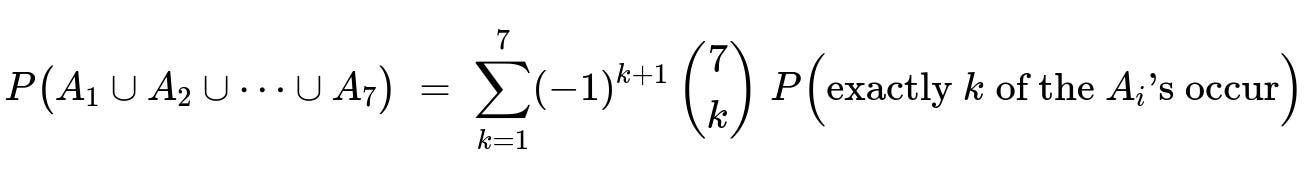
In this setting, “exactly k of the A_i’s occur” means exactly k stops are empty. The probability that exactly k distinct stops are empty is:
First choose which k stops are empty in (7 choose k) ways.
Then every passenger must choose from the remaining 7 - k stops, which each passenger does with probability (7 - k)/7 independently.
Thus, the probability for one specific choice of k stops to be empty is ((7 - k)^25)/(7^25).
Hence, the event “k of the stops are empty” has probability (7 choose k)*((7 - k)^25)/(7^25). When we collect all possible choices of those k stops and combine them with the (−1)^(k+1) factor from the inclusion-exclusion formula, we get the total probability that at least one stop ends up empty.
Performing the sum from k=1 to k=7 gives the probability that at least one stop is empty. Numerically, this sum evaluates to about 0.1438.
Final step
Once we know P(A_1 ∪ A_2 ∪ … ∪ A_7) = 0.1438, the probability that every stop has at least one passenger is:
1 − P(A_1 ∪ A_2 ∪ … ∪ A_7) = 1 − 0.1438 = 0.8562.
Hence, the probability that all 7 stops get used is 0.8562 (or 85.62%).
Follow-Up Question 1
How would you compute the expected number of stops that actually get used by the 25 passengers?
To answer this, define an indicator random variable X_i for each stop i, where X_i = 1 if at least one passenger gets off at stop i, and X_i = 0 otherwise. Then the total number of used stops, X, is X_1 + X_2 + … + X_7.
By linearity of expectation, E(X) = E(X_1) + … + E(X_7). Since each X_i is 1 if that stop is used, P(X_i = 1) = 1 − P(A_i), and P(A_i) = (6^25)/(7^25). Thus:
E(X_i) = 1 × (1 − (6^25)/(7^25)) + 0 × ((6^25)/(7^25)) = 1 − (6^25)/(7^25).
Because each stop is symmetric, E(X) = 7 × (1 − (6^25)/(7^25)).
Follow-Up Question 2
How might the probability change if passengers do not choose stops uniformly?
If each passenger has their own distribution over the 7 stops (for example, passenger 1 might favor stops 1 and 2, passenger 2 might favor stops 3 and 7, etc.), or if there is a known non-uniform distribution p_1, p_2, …, p_7 with p_1 + p_2 + … + p_7 = 1, the calculation becomes more complicated.
In that case, the probability of each passenger’s choice must be accounted for individually or collectively:
The probability that a specific stop i is empty is the product (over all 25 passengers) of the probability that a given passenger does not choose stop i.
The inclusion-exclusion would still apply, but instead of (7−k)^25 / 7^25, we would need to sum over the ways in which any given set of k stops is chosen by none of the passengers, multiplied by the probability of each passenger picking among the other stops based on their specific distribution.
Follow-Up Question 3
What if passengers do not act independently?
If passenger choices are correlated (for instance, if some travel in groups and must all get off at the same stop), the probability calculations would need conditional probabilities. The principle of inclusion-exclusion still formally applies, but quantifying P(exactly k stops empty) requires knowing the joint distribution of passenger stop choices.
For example, if a group of 5 passengers always choose the same stop, that correlation reduces the probability that all stops are used (because a block of 5 might always disembark together). One needs to precisely model these dependencies, which can be quite complex and might not yield a simple closed-form formula.
Follow-Up Question 4
Could you simulate this to verify the result?
Yes, a straightforward approach is Monte Carlo simulation. One could write a Python script that generates 25 independent uniform random choices among 7 stops for a large number of trials (say 1 million), then records the fraction of trials in which all 7 stops are used. This fraction will approximate the true probability.
A sample Python script:
import random

def simulate(num_trials=10_000_00):
    count_all_stops_used = 0
    for _ in range(num_trials):
        # Randomly assign each of 25 passengers a stop from 1..7
        stops = [0]*7
        for _ in range(25):
            stop_chosen = random.randint(0, 6)
            stops[stop_chosen] += 1

        # Check if all are non-zero
        if all(st > 0 for st in stops):
            count_all_stops_used += 1

    return count_all_stops_used / num_trials

approx_probability = simulate()
print("Simulated Probability:", approx_probability)
One would expect the printed result to be close to 0.8562 for a sufficiently large number of trials.
Follow-Up Question 5
How does this probability scale if the number of passengers or number of stops changes?
For a general setting with n passengers and m stops, the same reasoning applies but with:
Probability a specific stop is empty: ((m−1)^n)/(m^n).
The inclusion-exclusion sum to find the probability that all m stops are used becomes:
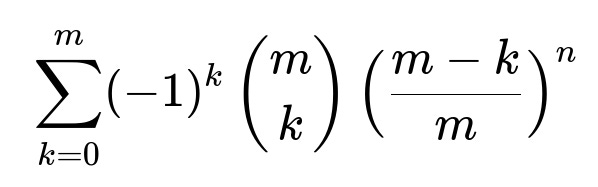
with the final probability of having all m stops used being that sum with the appropriate sign. For large n, the probability of all stops used tends to increase, but the exact rate depends on the relative growth of n vs m.
In practice, if the number of passengers is huge compared to the number of stops, the probability of covering all stops becomes very high. Conversely, if the number of passengers is relatively small, the chance some stop ends up empty grows.
These considerations cover some subtle points that could be explored in a rigorous interview discussion.
Below are additional follow-up questions
What is the probability that exactly j stops out of the 7 are used?
To find the probability that exactly j stops out of the total 7 receive at least one passenger, one approach is to use the concept of Stirling numbers of the second kind or the inclusion-exclusion principle (similar to the method used to find the probability that all 7 stops are used, but now focusing on exactly j of them). A helpful strategy is:
Choose which j stops out of the 7 are used.
Distribute 25 passengers among those j stops so that none of these j chosen stops is empty.
A known result is that the total number of ways to place n passengers into j stops with none empty is given by j! × S(n, j), where S(n, j) is a Stirling number of the second kind. Dividing by 7^n (the total number of ways to place n passengers among 7 stops if each passenger chooses uniformly) gives:
Here:
n = 25 is the number of passengers.
j ranges from 1 up to 7.
S(25, j) is the Stirling number of the second kind (the number of ways to partition 25 distinct objects into j nonempty subsets).
Potential pitfall: One might attempt to count distributions by ignoring the requirement that none of the j chosen stops can be empty. That would incorrectly include outcomes where one or more of those j stops are empty, leading to an overcount. Properly accounting for this using Stirling numbers or inclusion-exclusion avoids that pitfall.
What if each stop has a capacity limit?
In real-world settings, it is possible that each stop can only accommodate a certain maximum number of passengers disembarking. For instance, suppose stop i can hold at most c_i passengers. If we want the probability that no stop’s capacity is exceeded, the problem becomes more involved:
We can no longer simply assume each passenger independently chooses any stop without restriction. We must account for whether a stop is still available as passengers “arrive.”
If the capacity constraints c_i are not all equal, we must track the distribution of passengers across all stops in a combinatorial or enumerative manner.
One way is to consider all possible ways to distribute the 25 passengers subject to capacity constraints and divide by 7^25. Another approach uses generating functions if the number of passengers and capacities are moderate. However, for large counts or complicated constraints, an exact formula can be cumbersome. One might resort to Monte Carlo simulation or advanced combinatorial algorithms.
Potential pitfall: For capacity constraints, naive enumeration can be extremely large if 25 and 7 are big. Efficiency in a real project might require approximate methods or specialized algorithms (e.g., dynamic programming).
What if we require at least m passengers at each stop?
Instead of requiring “at least 1 passenger at each stop,” suppose we require at least m > 1 passengers at each of the 7 stops. This is sometimes referred to as an occupancy problem with a minimum occupancy constraint. The probability that at least m passengers disembark at every stop can be computed by suitably modifying the inclusion-exclusion approach:
In the standard inclusion-exclusion, event A_i means “stop i has fewer than m passengers,” rather than “stop i is empty.”
One then sums over the ways to choose which stops fail to meet the threshold m. For each chosen set of stops, one calculates how the 25 passengers can be placed in the other stops or partially placed if some stops meet the threshold and others do not.
Although the logic is analogous, the combinatorial expressions become more elaborate because we need to count configurations in which a chosen set of stops has fewer than m passengers (possibly zero, possibly 1, …, up to m−1), and the complementary set of stops collectively accommodates the rest. Typically, inclusion-exclusion remains the conceptual foundation.
Potential pitfall: Trying to directly adapt the formula for the “at least 1 passenger” scenario without carefully handling “at least m passengers” can produce severe undercounts or overcounts. Each chosen subset of stops must account for the varying ways in which those stops can have 0, 1, …, m−1 passengers.
How can one approximate the probability using a Poisson or other distribution?
When the number of passengers n is large and each passenger has a small probability p = 1/7 of choosing a given stop, it can be helpful to approximate the number of passengers at each stop with a Poisson(λ) distribution where λ = n × (1/7). For example, if n = 25, λ is about 25/7 ≈ 3.57.
To approximate the probability that all 7 stops have at least one passenger via a Poisson model, treat each stop’s passenger count as approximately Poisson(3.57) and (roughly) independent across stops. Then:
Probability(stop is empty) = e^(-λ).
Probability(at least one passenger per stop) ≈ [1 − e^(-λ)]^7.
While this Poisson approximation can be fast and offers intuitive insights for large n, it is only exact in the limit and does not perfectly capture correlations among stops. In many practical problems with moderate n (like 25), it might still give a respectable ballpark figure.
Potential pitfall: Assuming independence across stops in the Poisson approximation is not strictly correct when each passenger picks exactly one stop out of 7. Real correlations exist because a passenger choosing one stop automatically means fewer passengers can choose another. Nonetheless, for large n with uniform or near-uniform distributions, these correlations can be small enough that the approximation remains useful.
How would you handle partial bus routes or stops that only become available later?
In certain realistic situations, not all 7 stops might be available from the start—for example, the bus might only have 4 stops in the first segment, then 3 more are introduced after some passengers have already alighted. If the problem is that each of the 25 passengers chooses a stop but that some stops aren’t “open” until later:
We no longer have a straightforward scenario where each passenger can freely choose among 7 stops at once. The stops’ availability might depend on the route order or time.
The passenger’s choice might be limited to the stops that will be encountered while they are still on board. If a passenger leaves at an earlier stop, they are not around to choose among the later stops.
A rigorous model might need to track the route order, the time (or distance), and passenger decisions in that context. This complicates the probability that every stop eventually has at least one passenger because some passengers might have left the bus before certain stops are even reached.
Potential pitfall: Attempting to apply the same formula from the original “7 stops all equally and independently chosen” scenario can be quite inaccurate. Real constraints, such as a passenger not traveling to the final stops, must be incorporated into the model. One might need conditional probabilities for whether a passenger remains on the bus until each possible stop.
How do you handle the scenario of returning passengers or re-boarding?
If there’s a mechanism for passengers to re-board (unusual for a simple airport bus, but relevant in some settings), the independence assumption breaks. A passenger who re-boards could choose a second stop in addition to the first. In that case, even the notion of “25 passengers each choose exactly one stop” no longer holds. One might need:
A clear definition of how many times each passenger can disembark.
The probability model for multiple disembarking events per passenger.
From a probability perspective, if a passenger can choose multiple stops, the total passenger-stop choices can exceed 25. The inclusion-exclusion approach might still be adapted, but it will require rethinking what it means for “a stop to be used” (is it used if a passenger steps off for the first time, or second time?). This will drastically change the distribution of how many passengers get off at each stop.
Potential pitfall: Simply counting 25 as the total number of disembarking events is incorrect if re-boarding is allowed. The correct model might see more than 25 total disembarkings across the 7 stops, and independence is usually lost.
What if the number of passengers is random rather than fixed at 25?
A real-world situation might have uncertain passenger counts. Suppose we only know the expected number of passengers is 25, but the actual number can vary. In that case, we must incorporate the distribution of the total number of passengers, say a Poisson(25) or some other distribution:
First, draw the random number N of total passengers according to the chosen distribution.
Then, given N, each passenger independently chooses one of the 7 stops.
We want P(all stops used). This becomes an expectation of probabilities over the distribution of N. Concretely, if N is a random variable, we might write:
P(all stops used) = E [ P(all stops used | N) ] = sum over all possible N [ P(all stops used | N) × P(N) ].
Here, P(all stops used | N) is the probability all stops are used given exactly N passengers. For each fixed N, you can use the same inclusion-exclusion approach from before (replacing 25 with N). Then weight that by P(N) (the probability that N = some integer value). Summing or integrating (if continuous) over all possible N yields the final probability.
Potential pitfall: Using only the average number of passengers (like 25) in the original formula can lead to incorrect results if there is significant variability in the actual passenger count. One needs to integrate or sum over the distribution of the passenger count.
How do we handle the situation where the bus driver decides to skip stops under certain conditions?
Sometimes, the bus driver might decide not to stop if fewer than X people want to get off (to save time, for example). This modifies the probability question: “What is the probability that all 7 stops are used (i.e., the bus physically stops at them) under the new rule that the driver only stops if at least X passengers indicate they want to get off?” If X > 1, then it is no longer enough that at least 1 passenger picks that stop; we actually need at least X.
This is very similar to the scenario of “at least m passengers at each stop,” except that now the event “stop is used” is “≥ X passengers choose that stop.” You can adapt the earlier logic with:
A_i = “stop i has fewer than X people wanting to get off.”
Probability that a stop has r people is ( binomial distribution or a direct count ) / (7^25), but you typically incorporate these counts via an inclusion-exclusion or combinatorial approach.
Potential pitfall: It’s easy to mix up the probability that a single passenger picks a stop with the probability that the total number of passengers at that stop is at least X. A naive approach that only uses “1 passenger must pick the stop for it to be used” will not be correct in the scenario where the driver imposes a minimum group size to stop.
How would you determine the distribution of the number of stops used if each passenger chooses a stop with probability p_i that depends on i?
If the probability that a passenger chooses stop i is p_i (with p_1 + … + p_7 = 1), then the total number of passengers who choose stop i is binomially distributed with parameters n = 25 and success probability p_i, but correlated across different stops (because all p_i must sum to 1 for each passenger’s single choice).
To find the probability that exactly j distinct stops are used, you can again use inclusion-exclusion:
Let B_k be the event “stop k is not used,” meaning zero passengers pick stop k.
Probability(B_k) = (1 − p_k)^25.
For a set S of stops, Probability(all stops in S are unused) = product over k in S of (1 − p_k)^25 only if S covers all stops a passenger does not pick. But we must be careful because each passenger chooses exactly one stop among 7 with probabilities p_1, …, p_7.
Hence, to compute the probability that exactly j stops are used, you can sum over all subsets of size (7 − j) that remain empty, and incorporate the appropriate probability that none of the passengers selects those stops, while the other j stops are potentially used. This sum could be large if 7 is replaced by a bigger number, so in practice one might rely on a careful algorithm or simulation.
Potential pitfall: Misusing the binomial distribution for each stop separately is easy to do. Because each passenger can choose only one stop, the probabilities for different stops are not independent. One must carefully apply inclusion-exclusion rather than multiply individual probabilities or treat them as separate binomial random variables.
How does adding a new stop (making it 8 stops) change the probability that all are used?
If an additional stop is added (now 8 stops total), each passenger is equally likely to choose any of the 8 stops. We can ask how the probability that all 8 stops get at least one passenger compares with the probability that all 7 stops get used. Generally, when the number of stops increases while the number of passengers remains fixed, the probability that all stops are filled tends to decrease, since it’s harder to “cover” more stops.
To see why, notice that if we have n = 25 passengers and m stops, the probability that all m stops are used is:
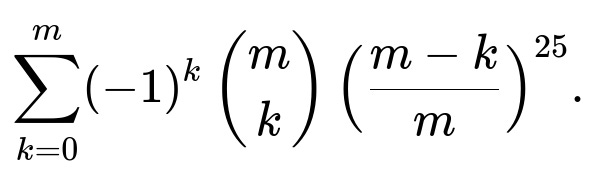
When we replace m=7 with m=8, the summation has more terms but also more ways for at least one stop to remain empty. Hence the final sum typically becomes smaller.
Potential pitfall: One might think the probability remains roughly the same if the added stop has no special attractiveness. However, purely combinatorial reasoning (25 passengers spread out among 8 rather than 7 bins) shows a noticeable drop in coverage probability.