
ML Interview Q Series: Calculating Expected Missing Items and Deviation Using Indicator Variables in Random Draws.

Browse all the Probability Interview Questions here.
An integer is repeatedly drawn at random from {1, 2, ..., 10}. What are the expected value and the standard deviation of the number of integers from {1, 2, ..., 10} that do not show up in 20 drawings? In each drawing of the Lotto 6/45, six different integers are randomly chosen from {1, 2, ..., 45}. What are the expected value and the standard deviation of the number of integers from {1, 2, ..., 45} that do not show up in 15 drawings?
Short Compact solution
For the first scenario (drawing integers from 1..10 in 20 independent draws):
Let Xᵢ = 1 if integer i does not appear in any of the 20 draws, and 0 otherwise.
Probability that a specified integer does not appear in a single draw is 9/10, so not appearing in 20 draws has probability (9/10)²⁰.
Hence E(Xᵢ) = (9/10)²⁰ and therefore the expected number of missing integers is 10 × (9/10)²⁰ = 1.2158.
The probability that two distinct integers i and j are both missing is (8/10)²⁰.
This leads to
Thus the variance is 2.2534 − (1.2158)², and its square root is the standard deviation ≈ 0.8805.
For the second scenario (Lotto 6/45 drawn 15 times):
Let Xᵢ = 1 if integer i does not appear in any of the 15 lotto drawings, and 0 otherwise.
Probability that a specified integer is not chosen in one Lotto 6/45 draw is 39/45, hence not chosen in 15 draws is (39/45)¹⁵.
Therefore, E(Xᵢ) = (39/45)¹⁵ and the expected number of missing integers is 45 × (39/45)¹⁵ = 5.2601.
The probability that two distinct integers i and j are both missing in a given draw is (43 choose 6)/(45 choose 6), which equals (39/45) × (38/44). Raised to the 15th power gives ( [39 × 38] / [45 × 44] )¹⁵ for the joint probability.
Hence

From this result, the standard deviation of X₁ + X₂ + … + X₄₅ turns out to be approximately 5.807.
Comprehensive Explanation
Part A: Draws from {1, 2, ..., 10}
Definition of random variables Define Xᵢ for i in {1, 2, ..., 10} by setting Xᵢ = 1 if the integer i does not appear in any of the 20 draws; otherwise Xᵢ = 0. Each draw is assumed to be uniformly random among the 10 possible integers, independently across the 20 draws.
Probability that a particular integer i does not show up In one draw, the probability that a particular integer (say i) is not drawn is 9/10. Over 20 independent draws, the probability that i never appears is (9/10)²⁰. Consequently, E(Xᵢ) = (9/10)²⁰.
Expected value of the total number missing Because the total number of missing integers is X₁ + X₂ + ... + X₁₀, linearity of expectation implies:

Inserting numbers, we get about 1.2158.
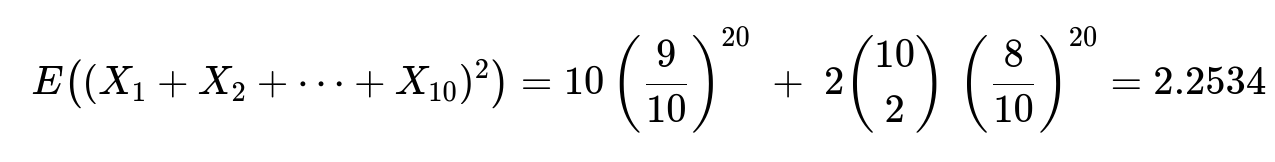
Second moment and standard deviation To find the standard deviation, we need Var(X₁ + ... + X₁₀). First, compute E((X₁ + ... + X₁₀)²), which is the sum of E(Xᵢ²) over all i plus 2 times the sum of E(Xᵢ Xⱼ) over i < j.
Since Xᵢ is an indicator variable (0 or 1), Xᵢ² = Xᵢ. So E(Xᵢ²) = E(Xᵢ) = (9/10)²⁰. For i ≠ j, XᵢXⱼ = 1 if both i and j do not appear at all among the 20 draws. The probability that i is missing and j is missing simultaneously is (8/10)²⁰ (because each draw excludes both i and j in that case). So E(XᵢXⱼ) = (8/10)²⁰. Therefore,

Once we have this sum, we subtract (E(X₁ + ... + X₁₀))² to get the variance. Taking the square root of that variance yields about 0.8805.
Part B: Lotto 6/45 drawn 15 times
Definition of random variables We now define Xᵢ for i in {1, 2, ..., 45} by Xᵢ = 1 if integer i does not appear in any of the 15 Lotto draws; otherwise Xᵢ = 0.
Probability a particular integer i does not appear in one Lotto draw A single Lotto draw picks 6 distinct integers out of 45. Hence the probability that a particular integer i is chosen in a single draw is 6/45, so the probability that it is not chosen in one draw is 39/45. Over 15 draws, the probability that integer i does not show up at all is (39/45)¹⁵. Thus E(Xᵢ) = (39/45)¹⁵.
Expected value of the total number missing By linearity of expectation, the total number of missing integers is X₁ + X₂ + ... + X₄₅, and its expectation is:

Numerically, this is about 5.2601.
Probability that two integers i and j both do not appear If i ≠ j, the probability that both integers i and j are missed in a single Lotto draw can be found by noticing that a single draw must choose 6 out of 45. The event “both i and j are not chosen” means those 6 are chosen from the remaining 43. Thus in one draw, the probability is (43 choose 6)/(45 choose 6). This ratio simplifies to (39/45) × (38/44). Therefore, over 15 independent draws,
E(XᵢXⱼ) = [ (39 × 38)/(45 × 44) ]¹⁵.
Second moment and standard deviation We sum these contributions for E((X₁ + X₂ + ... + X₄₅)²):

The expression evaluates to about 30.9292. From here, subtracting (5.2601)² to get the variance, we obtain a standard deviation (as given in the short solution) of approximately 5.807.
Potential Follow-Up Questions
Why can we use indicator variables to simplify the computation?
Using indicator variables Xᵢ = 1 if “event i happens” (in this case, “integer i is missing”) lets us take advantage of linearity of expectation and easily compute sums of these indicators. It avoids having to track more complicated random variables directly. By summing the simpler Bernoulli random variables, we use straightforward expectation formulas and then leverage combinatorial arguments for the pairwise probabilities.
How would the calculation change if draws were done without replacement in Part A?
In Part A, each draw is assumed to be from {1, ..., 10} independently. If we changed it so that each of the 20 “draws” had no replacement from a 10-element set (like dealing 20 cards from a 10-card deck), it would actually be impossible to have 20 unique selections out of only 10. Thus one must clarify carefully how the random draw is performed if there's any possibility of “exhausting” the set. For standard statements, “with replacement” is usually intended, so each of the 20 draws can be any integer from 1..10 independently.
Could we derive the distribution, not just the mean and variance, of the number of missing integers?
Yes. The random variable “number of missing integers” follows a Poisson-approximation-like distribution if the probability of missing any one integer is small, but more precisely, it follows the distribution of the sum of dependent Bernoulli indicators. One could in principle use inclusion-exclusion or more advanced combinatorial arguments to figure out the exact probabilities. However, for large sets or large numbers of draws, it often becomes more complex to do exact calculations, so in practice, many turn to either approximate methods or direct Monte Carlo simulations to characterize the full distribution.
How might we simulate this process in Python?
Below is a simple Python snippet that simulates the first scenario (the 10-integer draws) to estimate the expected value and standard deviation empirically:
import numpy as np

def simulate_draws(num_simulations=10_000_00):
    results = []
    for _ in range(num_simulations):
        draws = np.random.randint(1, 11, size=20)
        missing_count = 0
        for i in range(1, 11):
            if i not in draws:
                missing_count += 1
        results.append(missing_count)
    return np.mean(results), np.std(results)

mean_est, std_est = simulate_draws()
print("Estimated mean:", mean_est)
print("Estimated std:", std_est)
Such a simulation can be adapted for the Lotto scenario by simulating draws of 6 distinct integers from {1..45} and tracking which numbers fail to appear over multiple trials.
Could correlations across different integers affect the result if we tried to approximate?
Yes. The events “integer i is missing” and “integer j is missing” are correlated, because if the draws frequently include i, it might affect whether j is also included or not—especially in the Lotto setting where the draws are 6-distinct-integers sets. We must carefully compute the joint probability for the second moment, as was done here. Ignoring these correlations in certain approximations (like a naive binomial assumption) would not yield accurate second-moment (variance) estimates.
Such considerations highlight why the explicit use of E(Xᵢ Xⱼ) = P(Xᵢ = 1, Xⱼ = 1) is crucial for exact calculations.
Below are additional follow-up questions
What if the random draws in Part A or Part B had a slight bias instead of being perfectly uniform?
In real-world scenarios, a random draw mechanism might not be perfectly uniform. Perhaps there is some systematic bias: for example, in Part A, certain integers could be more likely to be drawn than others, or in the Lotto scenario, there could be biases in the selection process (though actual lotteries strive to avoid this). Even small deviations from uniformity can alter both the expected counts of missing integers and, in particular, their variance.
Detailed reasoning
If each draw has probability pᵢ for integer i (where the pᵢ must sum to 1), the probability that integer i never appears in n draws would become (1 − pᵢ)ⁿ.
The expected value would then be the sum of these probabilities over all integers i.
For the pairwise joint probabilities (for i ≠ j), we must consider the probability that both i and j are simultaneously excluded in each draw, which depends on (1 − pᵢ − pⱼ) if the draws are independent events of picking a single integer.
In a biased Lotto setting (where 6 distinct integers are drawn), the calculations become more nuanced, because we must account for the probability that each chosen 6-element combination might not be exactly uniform. In such a case, the combinatorial ratios (like (43 choose 6)/(45 choose 6)) would no longer hold precisely.
Practically, one might deal with these biases by re-deriving the probability expressions or, if the distribution is known, performing Monte Carlo simulation to approximate the new expected and standard deviation values.
A subtle pitfall is underestimating how a small bias can shift the probability of certain integers never appearing. Over many draws, these small differences can accumulate into larger discrepancies in both mean and variance.
How do we handle the situation if some draws are missing or we only have partial information about which integers were drawn?
Sometimes, real data could be incomplete: maybe we only know the total count of each integer appearing in a subset of the draws, or some draws are lost. Estimating the expected number of missing integers then requires a more intricate approach.
Detailed reasoning
We might model unknown draws as latent variables. For each missing draw, we either integrate (via the law of total probability) over all possible outcomes or use an expectation-maximization approach.
Uncertainty about certain draws increases the variance estimates since we must account for the possibility that certain integers could have appeared more (or less) times in those incomplete draws.
A Bayesian viewpoint could be employed, where we place priors on the number of times each integer is missing and then update those priors with partial observations.
A key pitfall arises if we assume the missing draws reflect the same distribution as the known draws. If the missing draws are not missing at random (for instance, data was lost more frequently when certain numbers were present), biases can lead us astray in our calculation of expected missing counts.
What if we group the integers into categories and ask about how many categories are completely missing?
Instead of focusing on individual integers missing, we might be interested in whether entire groups or categories of integers do not appear. For instance, we could split {1..10} into two ranges (e.g., {1..5} and {6..10}) and look at the probability that none from the first group appears in 20 draws.
Detailed reasoning
If each group has multiple integers, the probability that none of the integers in a category appear becomes the probability that every draw comes from outside that category.
For example, if we treat {1..5} as one group, the probability that this group is missing in a single draw is the probability that a draw comes from {6..10}, which is 5/10 if draws are uniform. Over 20 draws, it is (5/10)²⁰ for that group being missing entirely.
However, if we want the expected count of how many such categories do not appear, we must define a new set of indicator variables for each category, then sum and compute. The approach is analogous, but the probabilities and combinatorial terms become more involved.
A subtlety is overlap among categories if they are not disjoint or if we define more complicated category structures. Then indicator variables are no longer independent or even disjoint events. We must carefully handle these correlations.
How would we extend the logic to handle a scenario where the number of draws is random?
Sometimes, instead of having a fixed number of draws (20 in Part A, or 15 drawings in Part B), the number of draws itself might be a random variable—say, following a Poisson or geometric distribution. We would then want the distribution of the number of missing integers conditional on this random number of draws.
Detailed reasoning
If the number of draws N is random with some distribution, we can compute the expected number of missing integers via conditional expectation: E(X | N) is the usual formula for a fixed N. Then E(X) = E( E(X | N) ).
For instance, if N is Poisson(λ), then the probability that a given integer is not drawn in each draw is q (some constant), so the probability it is missing across all draws is E(qᴺ) = Σ (qⁿ)(λⁿ e^(-λ))/n!, summing from n = 0 to ∞.
This modifies not only the expected values but also the variance, because now we have additional randomness in the total count of draws.
A pitfall is forgetting to incorporate the extra variability introduced by uncertainty in N. This often leads to underestimation of the standard deviation if one pretends that N is fixed when in fact it is not.
What happens if, in the Lotto scenario, draws are actually dependent across time (e.g., some “rollover” mechanism)?
While standard Lotto draws are typically independent, a hypothetical scenario might include a correlation from one draw to the next—for instance, a rule that if a particular number is chosen once, its chance changes in subsequent draws (not standard for real lotteries, but can happen in certain contrived or promotional games).
Detailed reasoning
If the events are no longer independent across consecutive drawings, the probability that an integer is missing in all draws no longer factors as a simple product of identical probabilities. We need the joint distribution across draws to compute that integer’s chance of never appearing.
This dependence could be negative correlation (numbers chosen in prior draws are less likely in subsequent draws) or positive correlation (numbers that appear once might be more likely to appear again).
Calculating E(Xᵢ) might still be straightforward if we know the marginal probability each draw picks integer i. But E(XᵢXⱼ) becomes more complicated because the draws themselves are not independent.
A pitfall is to assume each draw is “like the last one.” That approach typically breaks if there is correlation or a shift in probabilities over time. Simulation or Markov chain modeling might be needed for accurate results.
How do we handle extremely large sets, like picking from {1..10^6}, while still computing expected values and standard deviations?
In machine learning or data analytics, one might deal with very large sample spaces. For example, sampling ID numbers from a population of 10^6 or 10^9. Although the same mathematics applies, direct computation of combinatorial expressions might become impractical.
Detailed reasoning
When the set size is large and the number of draws is relatively smaller, the probability that a particular item never appears might be approximated with exponentials, i.e., (1 − 1/M)ⁿ ≈ e^(−n/M), where M is the size of the set.
The linearity of expectation still simplifies the expected count of missing items to M × e^(−n/M). But for variance calculations, we also need pairwise terms that might be approximated or bounded using expansions of e^(−2n/M), etc.
A pitfall can occur if n is not small relative to M, making naive approximations inaccurate. Another pitfall is ignoring correlations. With large sets, one might rely on a Poisson or binomial approximation that is actually quite accurate in many practical regimes.
In industry-scale simulations, typically a mixture of analytic approximation (for the mean) plus Monte Carlo simulation (for the variance or tail probabilities) is used.
If the question asked for higher moments or confidence intervals, how would we proceed?
We often want more than just mean and variance—perhaps a confidence interval for the actual number of missing integers or an estimate of the probability that at least k integers are missing.
Detailed reasoning
Higher moments like E((X₁ + ... + Xₙ)³) or cumulants become increasingly complex because we must consider triple intersections (for i, j, k all missing simultaneously). For example, P(Xᵢ = 1, Xⱼ = 1, Xₖ = 1) in the simplest scenario is the probability that i, j, k are all excluded in every draw.
For 3 distinct integers in an independent selection scenario, that joint probability for each draw becomes (1 − pᵢ − pⱼ − pₖ) if the draws are independent picks of a single integer from the set. For the Lotto scenario, it is the proportion of ways to pick 6 from 45 that exclude those 3 integers.
Computing confidence intervals might involve normal approximations using the mean and variance, especially if n (the number of draws) or the set size is large enough for the Central Limit Theorem to apply.
A pitfall is blindly using a normal approximation when the distribution might be heavily skewed. For example, the number of missing integers is often bounded above by the total set size, and at small or intermediate draw sizes, the distribution can be quite discrete and skewed, so a normal approximation could be poor. Bootstrapping or exact combinatorial methods might be more accurate.