
ML Interview Q Series: Debug training loss decreasing while validation metric stagnates. Explain cost function's role in this issue.

📚 Browse the full ML Interview series here.
Hint: Potential overfitting, label noise, or mismatch between training loss and evaluation metrics.
Comprehensive Explanation
When your model’s training loss continues to decrease over epochs while the validation metric stays stagnant (or even worsens), it indicates that your model is potentially learning to fit training patterns that do not generalize to unseen data. This phenomenon can happen for several reasons. It is crucial to examine each component of the training setup, including the cost function, data quality, and alignment between training objectives and validation metrics.
A typical choice of cost function when dealing with classification problems is cross-entropy loss. Cross-entropy directly measures the divergence between the predicted probabilities and the true distribution. In many classification scenarios, this is a key objective function. The classical formula for cross-entropy in a multi-class setting is often presented as:
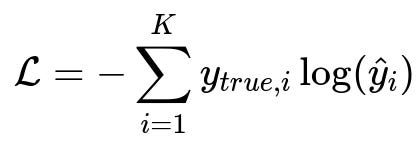
Here, y_{true,i} is 1 if the i-th class is the true class and 0 otherwise (one-hot encoding), and \hat{y}_{i} is the model's predicted probability for class i. This cost function strongly penalizes incorrect predictions by making the log term large (i.e., negative and big in magnitude) when the predicted probability for the correct class is small.
It is possible for the training algorithm to minimize this cost function effectively on the training set (hence the decreasing training loss) while failing to improve accuracy or F1-score on the validation set. This disconnect may happen because:
• The model overfits the training data and memorizes patterns or noise that do not translate into better generalization performance. • The training data may contain label noise or other corruptions. The model might continue fitting those noisy labels, improving training loss but not improving real predictive performance on clean validation data. • There could be a mismatch between the training loss (e.g., cross-entropy) and the validation metric (e.g., F1-score). Optimizing one does not always guarantee maximizing the other.
Debugging such a situation requires carefully examining each possible cause and then refining your model, data, or objective function in a systematic manner.
Potential Overfitting
Overfitting often manifests as a gradual decline in training loss, while validation performance plateaus or deteriorates. This can happen if the model has too many parameters or is trained for too many epochs without proper regularization. In a real scenario, you might:
• Introduce regularization techniques like L2 weight decay or dropout to discourage overfitting. • Use early stopping based on validation performance to halt training before the model overfits too severely. • Employ data augmentation (in computer vision or NLP contexts) to make the model more robust. • Gather more training data or use techniques like transfer learning if data is scarce.
If these steps result in improved validation metrics, it is strong evidence that overfitting was the core issue.
Influence of Label Noise
When there is significant label noise, the model might keep lowering its loss by fitting mislabeled samples. This will continue to reduce the training loss because the model can memorize or partially adapt to noisy labels. However, on the validation set (which presumably has fewer label errors), the learned patterns do not translate well into better accuracy, precision, recall, or F1-score. In that scenario:
• Carefully inspect the dataset for labeling errors or inconsistencies. • Re-label suspicious or ambiguous samples if possible. • Consider using robust loss functions designed to handle label noise (e.g., certain forms of weighted or noise-robust cross-entropy). • Implement data cleaning steps or active learning strategies to improve label quality.
Mismatch Between Cost Function and Validation Metric
When your training loss is cross-entropy and your validation metric is something like F1-score, you need to remember that cross-entropy loss focuses on probability calibration, while F1-score focuses more on finding the optimal decision threshold to maximize harmonic mean of precision and recall. If your thresholding is not tuned, or if you have a heavily imbalanced dataset, optimizing cross-entropy alone might not yield the highest F1-score.
To handle this:
• Tune the decision threshold on a validation set to optimize F1-score directly after the model is trained. • Try using training objectives that align more closely with the evaluation metric if threshold tuning is insufficient. For example, you might use differentiable approximations of F1-score or implement specialized loss functions for class imbalance. • Evaluate additional metrics (AUC, precision, recall) to check if there is a fundamental mismatch in how performance is measured.
Data Distribution Shifts
Sometimes, your validation set may come from a different distribution than your training set. The model might minimize loss on the training set distribution but fail to generalize to the validation distribution. Investigating distribution drift involves:
• Comparing summary statistics of training and validation sets (mean, standard deviation of features, label distribution) to see if they match. • Checking if sampling or data collection changed over time. • Potentially applying domain adaptation techniques or re-splitting the data to ensure that validation set is representative of the same distribution as the training set.
Diagnosing the Debugging Approach
Several techniques can help diagnose why validation metrics remain stuck:
• Plot or log training/validation loss curves to see if the model is saturating or diverging. • Evaluate different regularization intensities to see if a simpler model generalizes better. • Use a smaller subset of the training data to see if the model can rapidly overfit. If it cannot, there could be a data quality or label issue. • Track intermediate metrics (e.g., precision, recall, confusion matrices) to see if a specific subset of classes or data points are causing poor performance. • Experiment with different cost functions or add a term in the loss that tries to approximate your target validation metric.
Could There Be A Software Bug?
Occasionally, the issue is not purely conceptual but rather a bug in the data pipeline or in the evaluation loop. Common coding pitfalls include:
• Accidentally mixing up labels. • Not properly shuffling or splitting data. • Inconsistent preprocessing steps between training and validation. • Misaligned indices when using external data loaders.
Double-checking data loading, augmentations, label encoding, and the correct usage of libraries (e.g., PyTorch DataLoader or TensorFlow Dataset pipelines) can help rule out such bugs.
Example Code for Monitoring Training and Validation in PyTorch
import torch
import torch.nn as nn
import torch.optim as optim

# Suppose we have a simple model and data loaders
model = nn.Linear(10, 2)  # Example model
criterion = nn.CrossEntropyLoss()
optimizer = optim.Adam(model.parameters(), lr=1e-3)

train_loader = ...  # your training DataLoader
val_loader = ...    # your validation DataLoader

for epoch in range(100):
    model.train()
    total_train_loss = 0
    for data, labels in train_loader:
        optimizer.zero_grad()
        outputs = model(data)
        loss = criterion(outputs, labels)
        loss.backward()
        optimizer.step()
        total_train_loss += loss.item()

    # Compute training loss
    avg_train_loss = total_train_loss / len(train_loader)

    # Compute validation metric (e.g., accuracy)
    model.eval()
    correct = 0
    total = 0
    with torch.no_grad():
        for data, labels in val_loader:
            outputs = model(data)
            _, predicted = torch.max(outputs, 1)
            correct += (predicted == labels).sum().item()
            total += labels.size(0)
    val_accuracy = correct / total

    print(f"Epoch {epoch+1}, Train Loss: {avg_train_loss:.4f}, Val Accuracy: {val_accuracy:.4f}")
In a scenario where Train Loss continuously goes down but Val Accuracy stays unchanged, the debugging steps described above are a good starting point.
How This Relates to the Choice of Cost Function
If the mismatch persists between reducing training loss and stagnant validation metrics, investigate whether the cost function aligns with the intended validation goals. Cross-entropy is a good general-purpose objective for classification, but if your end goal is maximizing F1-score, you may need to adjust how you handle class imbalance, threshold optimization, or incorporate a metric-specific objective. A misalignment between training loss and real-world metrics can result in a model that is well-calibrated for the training distribution but fails to optimize your actual performance criteria on the validation set.
Could Overly Complex Models Hurt Validation Performance Even If The Cost Function Is Correct?
Yes, a model with too many parameters can simply memorize training examples. This leads to a scenario where training loss is driven down consistently, but the model fails to capture generalizable patterns. Even a well-chosen cost function can be overshadowed by the sheer capacity of a network that does not generalize. Techniques like early stopping, dropout, or L2 regularization often rectify this, highlighting that the fundamental cost function (e.g., cross-entropy) might be perfectly valid, but additional steps are required to enforce generalization.
Why Does Label Noise Specifically Affect Model Generalization?
If the training dataset contains incorrect labels, the model can continue to reduce training loss by fitting noisy or contradictory instances. However, on the validation set—assuming it is cleaned or has fewer errors—the model’s learned representations won’t translate into higher accuracy or F1-score. Large models, in particular, can memorize incorrect labels quite effectively without truly learning generalizable features. Checking data integrity and possibly removing or correcting problematic examples can mitigate these issues.
Are There Situations Where Mismatch Between Loss and Metric Is Acceptable?
In practice, optimizing cross-entropy loss remains common because it provides stable gradients for updating model parameters. Even though it does not directly optimize accuracy or F1-score, it is often correlated strongly enough with these metrics when the data distribution is balanced and the labels are reliable. If your domain’s main interest is something other than straightforward classification (such as maximizing recall for a medical test), you may need to modify your approach by using specialized losses, adjusting thresholds, or building an ensemble that focuses on the metric of interest.
When debugging persistent discrepancies between training loss and validation metrics, always look at broader aspects like data quality, distribution shifts, regularization, and the fundamental alignment between training objectives and the metrics you care about at evaluation time.
Below are additional follow-up questions
How do you determine if the discrepancy is simply due to a small or unrepresentative validation set?
A small or unrepresentative validation set can yield noisy or uninformative estimates of performance, causing the validation accuracy or F1-score to appear stagnant even if your model is actually improving. When the validation set is too small or does not adequately reflect the distribution of real-world data, a few misclassified examples can disproportionately impact the metric. This situation can be especially acute in multi-class problems where some classes have very few validation samples.
A practical approach is to increase the size of the validation set (while maintaining a balanced representation of classes) or to perform cross-validation. Cross-validation helps ensure each data point is used for both training and validation at different folds, providing a more robust estimate of performance. If performance metrics fluctuate greatly across folds, it suggests your splits or the data sampling process may be unrepresentative. Additionally, you can track confidence intervals for your validation metrics. If the intervals are large, it means the measurement is noisy, so you should gather more validation data to reduce uncertainty.
One real-world pitfall is that in specialized domains (like medical imaging or fraud detection), data collection is expensive and validation sets are often small. In such cases, carefully curated validation splits or domain experts reviewing borderline samples can mitigate the risk of misleading metrics. Ensuring each relevant class or condition is covered proportionally within the validation dataset is critical for reliable performance measurement.
Could the model be underfitting certain sub-populations of the data while overfitting others?
When a model’s training loss decreases steadily, it often implies that the model is capturing patterns in at least a portion of the training data. However, it might be memorizing or overfitting certain sub-populations (such as majority classes or easy-to-classify instances) while failing to learn robust representations for minority classes or more challenging data segments. In the validation set, this discrepancy manifests as unimproved overall metrics because the model underperforms on these unlearned sub-populations.
To diagnose this, you can analyze per-class accuracy, confusion matrices, or any relevant group-based performance metrics (e.g., stratifying by demographic groups in fairness-sensitive applications). If specific classes or groups always lag, it signals that the model does not generalize well to them. Potential fixes include class rebalancing, data augmentation that focuses on underrepresented sub-populations, or specialized sampling techniques like oversampling or SMOTE in tabular data scenarios. An important edge case is a highly imbalanced dataset in which the model may achieve low loss by heavily biasing predictions toward the dominant classes, without improving the metric you care about on minority classes.
Are there any hyperparameter settings or optimization schedules that might mask actual improvements in validation performance?
Hyperparameters such as the learning rate, momentum, or the choice of optimizer can affect how quickly and in what manner the model converges. Sometimes, training loss steadily declines because the learning rate is high enough to keep updating the model parameters, yet the model’s decision boundaries on the validation set remain suboptimal due to overly aggressive or poorly tuned updates. Additionally, poor learning rate schedules can cause the model to oscillate around minima without consistently improving the validation metric.
One subtle pitfall is that you might inadvertently tune hyperparameters primarily based on training loss trends rather than validation metrics. This can trap you in configurations that rapidly reduce training loss but do not generalize well. It’s crucial to systematically vary learning rates, batch sizes, or regularization strengths while monitoring how each hyperparameter setting affects both training loss and validation performance. Employing techniques like a learning rate finder or a cyclic learning rate policy can help identify better schedules.
In real-world scenarios, especially when training large-scale models, small differences in hyperparameter choices become more pronounced over many epochs. You may think your model is improving if the training loss is dropping, but if your chosen learning rate schedule is too aggressive in the later epochs, the model might have trouble converging to a validation-optimal point.
Could the preprocessing or feature engineering steps be unintentionally boosting training performance without helping on validation data?
Feature engineering or data preprocessing steps sometimes become over-tailored to the training data distribution. For example, if you normalize or encode features based on the entire training set, you might inadvertently leak information about the distribution of the training set into the model in a way that does not apply to new, unseen data. This can cause artificially low training loss but yield no corresponding improvement on the validation metric.
Common pitfalls include: • Using training data statistics (means, variances) incorrectly when normalizing test data. • Mishandling time-series data where future information inadvertently seeps into earlier time steps. • Applying an overly aggressive dimensionality reduction that discards relevant validation set features.
To address this, ensure that your preprocessing is separated for training and validation sets. For instance, compute normalization parameters on the training set only, then apply the exact same transformations to validation. Also, confirm that any feature selection or dimensionality reduction is either performed using cross-validation or is purely derived from the training set to avoid data leakage. Real-world data pipelines can become quite complex, especially when combining multiple data sources, so methodical checks are essential.
How might incomplete or partially labeled data lead to a disconnect between training loss and validation metrics?
In some projects, particularly large-scale applications, you might not have labels for every sample. You may attempt to leverage semi-supervised or weakly supervised approaches where partial labels are used to guide training. In such a setup, your model could be lowering its training loss on labeled samples or aligning with noisy pseudo-labels but failing to generalize to a fully labeled validation set.
A key edge case arises if the labeling process is inconsistent across different subsets of data. For example, some segments might be labeled meticulously, whereas others rely on automatically generated pseudo-labels. Even if training loss improves, it may reflect overfitting to the partial or noisy labels. The validation set, with higher-quality labels, sees no improvement.
Diagnosing this requires close inspection of the label acquisition process. Evaluate the difference in label quality across data partitions and consider applying consistency checks or additional noise-robust learning methods. If the model is heavily reliant on pseudo-labeled data, you might refine or retrain the pseudo-labeler itself or use iterative approaches where the model’s predictions are validated or filtered to gradually improve label quality.
How do you recognize and address cases where your metric saturates early but the loss continues to decrease?
Sometimes, your validation metric might plateau at a high level relatively early in training, while the training loss continues to decline. In such scenarios, improvements in the model’s probability calibration might not translate into a higher threshold-based metric like accuracy or F1-score. Once the model already achieves near-perfect classification on the majority of validation samples, further small improvements in loss do not reflect as a jump in the discrete metric.
A typical real-world example is when your dataset is relatively easy to classify. After the model masters most samples, the last few hard examples do not significantly impact accuracy or F1-score. Another situation is a misalignment between your threshold-based metric and the model’s continuous probability outputs. If you see that the metric saturates but you still want better calibration or lower misclassification costs, you might shift focus to metrics like log loss or calibration error. Alternatively, you might choose to refine the decision threshold post-training to see if those improvements in probability predictions can yield even a slight improvement in the validation metric.
What are potential pitfalls when using automated hyperparameter search methods in this scenario?
Automated hyperparameter search techniques—like Bayesian optimization, grid search, or random search—rely on a performance metric (usually the validation metric) to identify the best hyperparameter set. If the validation metric is not improving but the training loss is dropping, an automated procedure might overlook truly promising configurations. The hyperparameter search could converge prematurely to a local optimum that reduces training loss rapidly without generalizing.
Another subtle issue is that many automated search tools assume that metric measurements are stable enough to guide them. When the validation metric is highly variable or uninformative, the search may yield misleading results. For instance, if certain hyperparameter sets produce minimal changes in the validation metric because of data noise or distribution mismatches, the search algorithm might discard those sets—even though they might perform well on a properly sampled or larger validation set.
A good practice is to monitor training and validation curves for each hyperparameter candidate. By doing so, you can catch signs of overfitting or identify if the metric is stuck at a low plateau. Sometimes, you need to either refine your validation strategy (e.g., using cross-validation or a larger validation split) or pick more reliable metrics. This ensures that automated search truly captures generalization capability rather than just fast decreases in training loss.