
ML Interview Q Series: Election Flip Probability: Hypergeometric Analysis of Randomly Removed Illegal Votes.

Browse all the Probability Interview Questions here.
Suppose there is a close election between two candidates A and B, with final counts 1422 votes for A and 1405 votes for B. However, it is discovered that 101 votes are illegal and must be removed. Assuming the illegal votes are equally likely to be among either candidate’s votes (i.e., no bias in how the illegal votes were cast), what is the probability that removing these 101 votes changes the election result (making A no longer the winner)?
Short Compact solution
We can model the situation by imagining an urn with 1422 white balls (representing votes for A) and 1405 black balls (representing votes for B). We randomly remove 101 balls (the illegal votes). The probability that the outcome changes is the probability that, after removal, the white balls are not strictly more numerous than the black balls.
This event occurs precisely when the number of removed white balls is at least 59. Hence, the probability is:
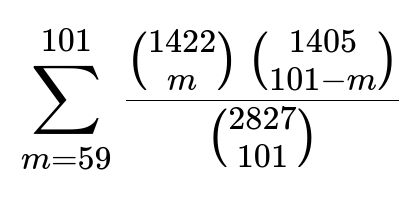
Numerical evaluation of this sum yields approximately 0.05917.
Comprehensive Explanation
Interpretation via Urn Model
An intuitive way to frame the problem is to treat each vote for candidate A as a white ball and each vote for candidate B as a black ball. We have a total of 1422 white balls and 1405 black balls, for a combined total of 1422 + 1405 = 2827 balls. From these 2827 votes, a subset of 101 votes (the illegal ones) will be removed at random.
Let m be the number of white balls in the removed set of 101. Then:
The remaining white balls in the urn is 1422 - m.
The remaining black balls in the urn is 1405 - (101 - m) because out of 101 removed, (101 - m) are black.
We want the probability that candidate A’s final total is no longer strictly greater than candidate B’s final total, i.e., 1422 - m <= 1405 - (101 - m). Rearranging yields m >= 59. Therefore, the only way for the outcome to change is if at least 59 of A’s votes end up in the set of 101 removed votes.
The Combinatorial Sum
To compute this probability, we sum over all possible values m from 59 to 101. For each m in that range:
C(1422, m) is the number of ways to choose m of A’s votes from his 1422.
C(1405, 101 - m) is the number of ways to choose (101 - m) of B’s votes from her 1405.
C(2827, 101) is the number of ways to choose any 101 votes from the total 2827 votes.
Since all illegal sets of 101 votes are equally likely, the probability is the ratio of favorable outcomes to total outcomes. The final sum is:

When evaluated, this sum yields approximately 0.05917, meaning there is roughly a 5.917% chance that removing the illegal votes reverses or ties the outcome of the election.
Why m >= 59?
The margin of candidate A over candidate B is 17 votes (1422 - 1405 = 17). To eliminate A’s lead, candidate B must either tie or surpass A once 101 votes are removed. If m white votes are removed and (101 - m) black votes are removed, then the difference between A’s and B’s final totals shifts by (m - (101 - m)) = (2m - 101). We require that shift to be at least 18 in favor of B (to cover the original 17-vote lead and go to a tie or worse for A). Solving 2m - 101 >= 18 leads to m >= 59.
Connection to the Hypergeometric Distribution
This situation is a classic example of a hypergeometric scenario: from a finite population of 2827 items (1422 “successes” and 1405 “failures”), we draw 101 items without replacement. We are interested in the probability that the number of drawn successes (m) meets or exceeds a threshold (59). The hypergeometric probability mass function is used for these kinds of discrete, no-replacement draws.
Implementation Example
In Python, one could directly compute the sum (though care with large binomial coefficients is required). For instance:
import math

def comb(n, k):
    return math.comb(n, k)

p = 0
total_ways = comb(2827, 101)
for m in range(59, 102):
    ways_A = comb(1422, m)
    ways_B = comb(1405, 101 - m)
    p += ways_A * ways_B

probability = p / total_ways
print(probability)
This code simply sums up the favorable ways for m = 59 to 101 and then divides by the total possible ways of removing 101 votes from 2827. It should produce a result near 0.05917.
Follow-up question: Connection to Large Sample Approximations
When the number of votes is extremely large, can we approximate this probability using a normal approximation?
Absolutely. For much larger counts, some interviewers might allow a normal approximation to the hypergeometric distribution. The hypergeometric distribution can be approximated by a binomial or normal distribution under certain conditions. In large-n election problems, we sometimes use a binomial approximation with p = proportion of A’s votes in the population. However, with 2827 total votes here, the exact combinatorial or hypergeometric formula is still quite feasible to compute directly.
Follow-up question: Edge Cases and Practical Considerations
What if the margin is 1 instead of 17?
If A is ahead by a single vote, then B needs to remove at least one more of A’s votes than B’s own votes to change the result. You could recompute the threshold condition to see that m >= (101 / 2 + 0.5) or a simpler rearrangement depending on the margin. The same hypergeometric approach remains valid, but the threshold changes accordingly.
What if the 101 illegal votes are suspected to be biased?
Our assumption of no bias is critical. If, for instance, there were a reason to suspect the illegal votes were predominantly in favor of one candidate, the probability distribution for m (the number of A’s votes removed) would shift. We could model that with different sampling probabilities or, if partial knowledge is available, use Bayesian updates to incorporate prior beliefs about which candidate is more likely to have illegal votes.
Follow-up question: Practical Implementation Challenges
If the combinatorial terms become numerically huge, how can we handle overflow?
When computing large binomial coefficients in Python, math.comb(n, k) uses efficient techniques internally. However, in other languages or older libraries, overflow might be an issue. One workaround is to compute log binomial coefficients and exponentiate at the end. Alternatively, if we only need a ratio of combinatorial terms, we can simplify those ratios to reduce intermediate values. Libraries like NumPy and SciPy also provide robust implementations for the hypergeometric PMF that handle large numbers more gracefully.
Below are additional follow-up questions
What if some votes are known to be definitely valid for Candidate A or Candidate B?
In real-world scenarios, certain clusters of votes may be known with near certainty to be valid or invalid, or to have definitely gone to a particular candidate. For instance, imagine a small number of mail-in ballots that have already been confirmed to be legal and for Candidate A. How would that affect the probability calculation?
Answer (Detailed Explanation)
Modification of the “Population” If you have a subset of A’s votes that are guaranteed legitimate, you effectively remove these votes from the random draw. Suppose out of the 1422 votes for A, 100 are known to be legally cast, so only 1322 remain subject to the random illegal-removal process. Then your total number of “eligible to be illegal” A votes changes from 1422 to 1322. Likewise, if some subset of B’s votes are also known to be definitely valid, you adjust the black-ball population accordingly.
Impact on the Probability Because the initial assumption of a uniform distribution of illegal votes among all of A’s and B’s votes is no longer correct, the hypergeometric model must be adapted. The new hypergeometric population excludes the guaranteed legal votes from both sides. The random draw of 101 illegal votes now comes from the smaller set:
White votes possibly illegal: 1322
Black votes possibly illegal: (whatever portion is uncertain among the 1405)
Practical Considerations If the subset of guaranteed-legal votes is large, A (or B) might effectively insulate themselves from too many of their votes being removed. This reduces the probability the outcome changes because you’ve shrunk the pool of candidate A’s votes that can be removed as illegal. Conversely, if guaranteed-legal votes mostly belong to B, the risk to A is higher.
Edge Case If all of a candidate’s votes are either guaranteed legal or guaranteed illegal, the problem becomes trivial: that candidate’s final count is essentially known. The only random portion affects the other side’s votes.
How does the problem change if the total votes (legal + illegal) are not known exactly?
Sometimes there is uncertainty in the total count itself—e.g., local records might show slight discrepancies, or not all provisional ballots are accounted for. If we don’t even know if the total is 2827, how would we approach the calculation?
Answer (Detailed Explanation)
Stochastic Population Size If the total of 2827 votes is itself uncertain, we can consider a distribution over possible total votes. For each total T in a range (say 2825 to 2830 if small uncertainty is suspected), we can compute a probability of T being the true total. Then we treat the problem as a mixture model:
For each T, compute the probability of reversal using the hypergeometric formula (with the margin and T - 101 total draws).
Weigh each scenario by the prior probability that T is the correct total.
Propagating Uncertainty The overall probability of reversing the outcome is then the sum or integral over T of [Probability(Reversal | T) × Probability(T)]. This yields a more nuanced measure that accounts for uncertainty not only in who has the illegal votes but also in the overall vote count.
Practical Issues
Determining the distribution for T can be tricky if the uncertainty arises from incomplete records or inconsistent tallies.
In practice, election authorities often focus on known tallies and might ignore small uncertainties unless they exceed the margin of victory.
Could the selection of illegal votes be dependent on the time or method of casting?
Real-world illegal votes might not be uniformly distributed across the entire population. For example, suppose it’s discovered that the illegal votes are all from one district that strongly favored Candidate B. How does that affect our model?
Answer (Detailed Explanation)
Breaking the Uniformity Assumption The hypergeometric approach critically assumes that any vote is equally likely to be illegal. If illegal votes come disproportionately from a region or method that favors one candidate (e.g., they are all from a district with 70% B support), the probability distribution of m (the number of A’s votes in the removed set) changes.
Conditional Probability Calculation
If the illegal votes are known to come from a district with p fraction of A’s supporters (p < 1422/2827 if the district leans B), then the expected proportion of A’s votes among the illegal ballots is p, not 1422/2827.
We would then do a hypergeometric selection but only from that district’s proportion of total A and B votes. This changes the population ratio we use in the binomial or hypergeometric formula.
Outcome Typically, if the illegal district is strongly in favor of B, that could reduce or increase the chance of A losing, depending on how large the B-lean is. If B had a strong lead in that district, removing those illegal votes might actually help A, or it might remove just enough B votes. The direction depends on the relative shares.
Conclusion Whenever illegal votes are localized to a subset of votes that is not representative of the overall population, you must tailor the hypergeometric parameters to that subset’s known ratio. A naive uniform approach can be significantly off.
How does sampling or partial auditing of illegal votes affect the final probability?
In many election integrity processes, officials might examine a small portion of votes suspected to be illegal before deciding to discard them. How does knowledge from a partial sample affect the probability of flipping the outcome?
Answer (Detailed Explanation)
Bayesian Update Suppose we draw a small sample of the suspicious 101 ballots to see how many belong to A vs B. If in a sample of 10, we find 6 for A and 4 for B, that suggests a higher fraction of the illegal votes might belong to A. We can perform a Bayesian update on the parameter p = fraction of A’s votes among the illegal 101.
Posterior distribution for p will be updated given the observed 6 out of 10.
The subsequent probability of having m A votes in the full 101 might shift upward.
Revising the Probability After the Bayesian update, we recalculate the chance that the final number of illegal A votes is enough to flip the result. This typically involves summing over the posterior distribution of p. The final estimate may be significantly different from the naive uniform assumption if the sample indicates strong skew in illegal votes.
Practical Relevance Elections sometimes use risk-limiting audits or partial checks. Observing that the illegal ballots are predominantly from one candidate can drastically change the probability that the final removal flips the outcome.
How do ties factor into the probability?
Our formula focuses on the event that A’s total is no longer strictly greater than B’s total. But what if we distinguish between the outcome being a tie vs. B actually surpassing A? Should we compute separate probabilities?
Answer (Detailed Explanation)
Tie vs. B Surpassing
We required 1422 - m <= 1405 - (101 - m). This condition lumps ties and B wins together.
If you want the exact probability of a tie, set 1422 - m = 1405 - (101 - m) which simplifies to m = 59.
If you want the probability that B surpasses A, you need m > 59.
Separate Probabilities
Probability of tie: sum the hypergeometric term for m = 59 specifically.
Probability of B surpassing: sum the terms for m = 60 to 101.
Implications In some real elections, a tie triggers a runoff or special procedure. Distinguishing these cases can be critical for legal and logistical reasons.
Edge Case If the margin is bigger or smaller, the exact threshold for a tie changes. Always re-derive the threshold formula for tie conditions vs. outright flip.
What if we suspect more than 101 illegal votes but only 101 are definitely identified?
Occasionally, an election might have a known subset of definitely illegal votes (101 in this scenario), but there could be an additional unknown quantity of potentially illegal votes. How does that uncertainty affect the outcome probability?
Answer (Detailed Explanation)
Two Categories of Illegal Votes
Category 1: 101 definitely illegal votes.
Category 2: X additional “potentially illegal” votes. We are not sure if X = 0 or up to some maximum.
Layered Probability
We first do the standard calculation for the 101 definitely illegal. That yields a baseline probability of flipping the election.
If some fraction of the additional X votes later turn out to be confirmed illegal, that could lead to a second draw from the pool of votes.
Sequential Removal If the election rules state that only the identified 101 are removed now, and any further illegal votes might be addressed later, you can treat it as a second-stage hypergeometric process. The unconditional probability of flipping becomes more complex and depends on how likely it is for additional ballots to be identified and how many of them belong to each candidate.
Practical Complexity In practice, election officials rarely deal with multi-stage indefinite sets of illegal votes, but if it happens, you must carefully account for each stage’s effect on the margin and the chances it overturns the result.
Is there a direct formula for the expected shift in margin?
Sometimes we might be interested in the average change in margin after removing 101 random votes. Is there a straightforward expected value approach?
Answer (Detailed Explanation)
Expected Value of m If the illegal votes are chosen uniformly at random, the expected number of A votes removed m is 101 * (1422 / 2827). The expected number of B votes removed is 101 * (1405 / 2827).
Expected Shift The change in margin is E[m] - E(101 - m) = E[m] - (101 - E[m]) = 2 * E[m] - 101. Substituting the expected m, that becomes 2 * [101 * (1422 / 2827)] - 101.
Limitations The expected shift might be zero or negative, but that doesn’t directly tell us about the probability the final margin crosses zero. A distribution can have a small mean shift yet a significant tail where the margin flips. That’s why we rely on the hypergeometric probabilities for exact calculations.
Could the result still change if certain votes were invalidated for other reasons?
Sometimes, a set of 101 illegal votes is identified, but concurrent developments might cause another batch of votes to be invalidated for different reasons (e.g., signatures not matching, legal disputes). Does that scenario alter our probability?
Answer (Detailed Explanation)
Multiple Independent Removals If a separate process invalidates an additional K votes beyond the 101 known illegal, we have two (or more) sets of removed votes. If these sets can overlap or not, the calculations become more complicated. If they don’t overlap, the total removed is 101 + K.
Overlap vs. No Overlap
No Overlap: We effectively remove 101 from the population for the first reason, and K from the remainder for the second reason. The final number of A’s vs. B’s votes might be derived by sequentially applying hypergeometric draws or by a combined formula for removing 101 + K from a known population.
Potential Overlap: If some votes are counted in both the “illegal” set and the “likely invalid” set, double-counting arises. We must carefully model the probability that a given vote belongs to either or both sets.
Practical Edge Cases In real elections, overlapping disqualifications can occur if multiple rules disqualify the same ballot. This complicates any single-step model. Often, election law resolves these issues by applying the strictest applicable disqualification rule.
What if the margin is actually negative (i.e., B is currently leading) and we are checking the probability of flipping in favor of A?
Most likely, you still apply the same logic, but simply interpret the question: “What is the chance that after removing 101 random votes, A ends up leading?” How does that work?
Answer (Detailed Explanation)
Generalizing the Threshold If A is behind by M votes, the condition to flip is 1422 - m > 1405 - (101 - m). If M = 3 for example (meaning B leads by 3), you want A’s final count to exceed B’s, so the threshold for m changes.
Hypergeometric Approach The same combinatorial expression is used, but you set up the inequality for A to surpass B’s final total. Solve for m accordingly, and sum from that threshold to 101.
Interpretation Because A is behind, you need a big enough fraction of B’s votes removed and a small enough fraction of A’s votes removed. You can interpret it as “m is not too large” if B is leading. So the direction of the inequality flips.
How do we handle a scenario with more than two candidates?
If there are multiple candidates, say A, B, and C, and we only focus on whether A remains in first place after removing 101 random votes, is the approach still valid?
Answer (Detailed Explanation)
Multinomial Sampling Instead of a hypergeometric distribution with two categories (A or B), we have a hypergeometric distribution over three categories: A’s votes, B’s votes, and C’s votes. But more precisely, it’s a multivariate hypergeometric distribution because we draw 101 ballots from a population partitioned into (A_count, B_count, C_count).
Probability A Remains in the Lead You would need to sum over all combinations (mA, mB, mC) such that mA + mB + mC = 101, and check the resulting totals for each candidate:
A’s final total = A_initial - mA
B’s final total = B_initial - mB
C’s final total = C_initial - mC Then sum those scenarios that lead to A still on top.
Complexity The summation becomes much larger since it extends over a 2D or 3D region (for three or more candidates). Tools like dynamic programming or direct usage of
scipy.stats.hypergeomor custom loops might be needed to handle it efficiently if the numbers get large.Practical Edge Cases With three or more candidates, the concept of “changing the result” could mean A drops from first to second or third. Additional complexities arise if a tie for first place triggers a runoff. Each scenario might require separate probability computations.
Are there any sequential sampling methods that might simplify the computation?
Consider the scenario where illegal votes are removed one by one, sequentially. Can we model the probability of flipping the result in that sequential manner more simply?
Answer (Detailed Explanation)
Sequential Perspective Imagine drawing one illegal vote at a time (though in reality we remove 101 at once). We track how often we pick an A vote vs. a B vote as we proceed. If after some number of draws the margin is reversed, that determines the final outcome.
Equivalent to Hypergeometric While it might sound simpler in some respects, the mathematics remains exactly the same because each draw without replacement is identical to a single draw of size 101 from the entire set.
Stopping Times Sometimes you might be interested in the probability that the margin flips before you’ve removed all 101 illegal votes. This is akin to analyzing a negative hypergeometric distribution (the distribution of draws until a certain event occurs). While interesting, it doesn’t change the final probability that after 101 removals, A loses.
Practical Use A step-by-step process might give intuition or a mechanism for a running tally. However, from a purely mathematical standpoint, the direct hypergeometric formula is a more straightforward approach.
Could weighting each vote differently change the calculation?
In real elections, all votes are treated equally, but suppose hypothetical scenarios where certain votes (e.g., from different regions) are weighted differently in the event they are deemed partially invalid. How does that alter the approach?
Answer (Detailed Explanation)
Non-Binary Outcomes If some votes are “half counted” or have a weighting factor, then removing them doesn’t fully remove 1 from that candidate’s total but maybe 0.5. This is no longer a discrete yes/no removal scenario.
Generalization You’d have to consider each vote as having a weight w_i. Removing a vote with weight w_i changes the candidate’s total by w_i. The sum of weights for A is 1422 in the standard scenario (since each vote weighs 1), and for B is 1405.
Combinatorial Counting The combinatorial approach becomes more complicated because each subset of 101 illegal votes has a unique sum of weights. One might approximate by turning the problem into a continuous domain and applying integrals or using more advanced combinatorial methods.
Practical Relevance Weighted votes are uncommon in real elections, but partial disqualifications do occur (e.g., partial invalidation of ballots that only excludes certain down-ballot races). Typically, an entirely separate count or partial re-check is performed to handle those complexities.