
ML Interview Q Series: Expected Number of Draws for Increasing Sequences Using Permutation Probability

Browse all the Probability Interview Questions here.
You repeatedly draw values from an unending set of i.i.d. random variables uniformly distributed over (0,1). You continue drawing as long as the sequence of observed values remains strictly increasing. On average, how many draws do you make?
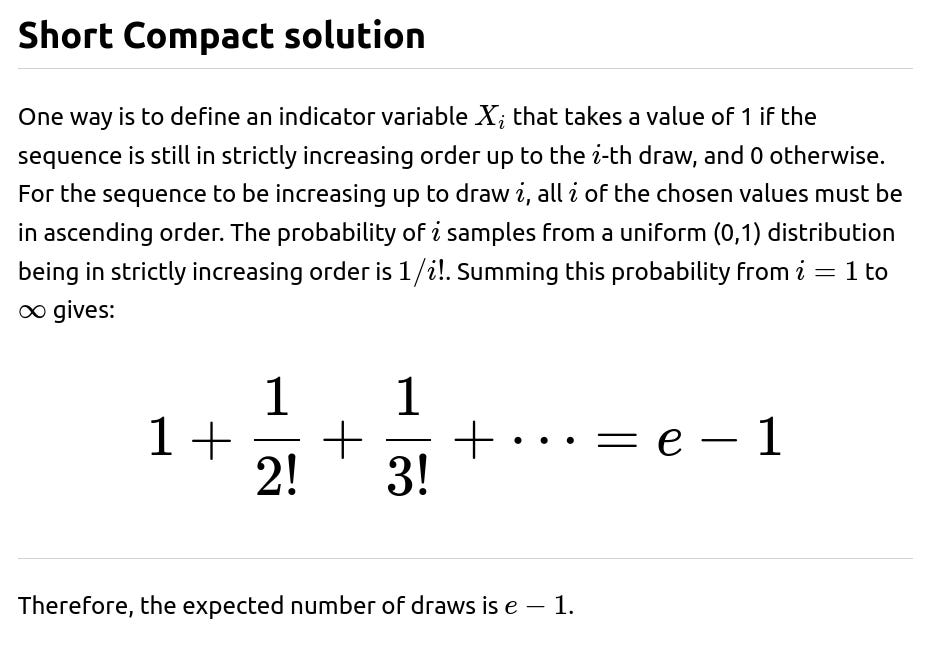
To find the expected length, we sum the expectations of these indicator variables:

In simpler terms, with probability 1 you will have at least one draw (the first draw). Then there is a 1/2! chance that the first two are in ascending order, a 1/3! chance that the first three are in ascending order, and so on. Adding all these probabilities yields e−1, approximately 1.71828.
This result highlights a neat combinatorial property: for each finite i, it is relatively unlikely for all i samples to line up perfectly in ascending order, but we can still sum up these small probabilities.
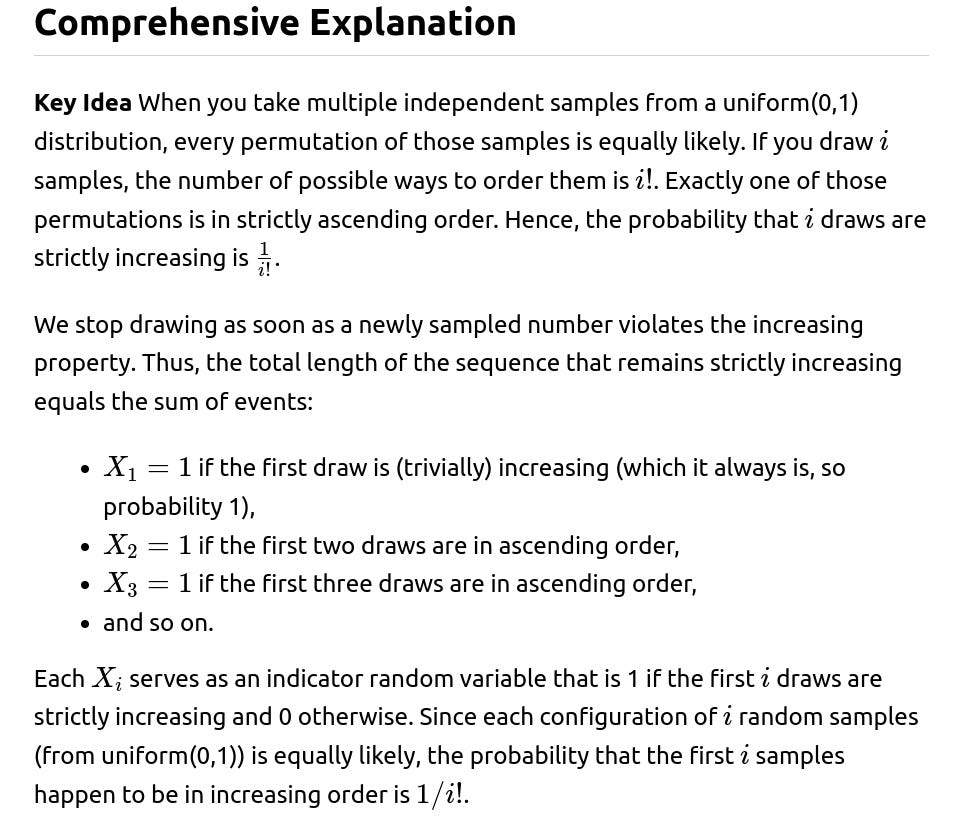
Why 1/i!? When you have i continuous random draws from (0,1), the space of outcomes is symmetric with respect to all permutations of these i values. In total, there are i! equally probable ways of permuting i distinct values. Only one such arrangement is fully ascending, so the probability of that ascending arrangement is precisely 1/i!.
Summary
Draw from Uniform(0,1) repeatedly.
Once you fail to draw a higher number than all previously drawn numbers, you stop.
The expected length before stopping is e−1.
Follow-Up Question 1
Why does the event “the first i draws are in increasing order” translate into exactly one permutation out of i! possible orders? Couldn’t the draws have repeats?
Even though the uniform(0,1) distribution is continuous, the probability of drawing exactly the same number more than once is effectively zero. This makes each draw distinct almost surely. Thus, among i distinct real numbers, there are i! equally probable permutations. Exactly one of these permutations has them sorted in strictly ascending order. Hence, repeats do not affect the analysis.
Follow-Up Question 2
What if we wanted the sequence to be non-decreasing instead of strictly increasing?
For continuous distributions, the probability of ties is zero, so “non-decreasing” is effectively the same as “strictly increasing.” If we allowed discrete distributions where ties can happen, we would need to account for additional sequences where numbers can repeat yet still qualify as non-decreasing. In the continuous case (uniform(0,1)), the probability of any two values being equal is zero, so the result remains the same at e−1.
Follow-Up Question 3
Is there a way to simulate this process in Python to verify the result?
Below is a simple simulation that approximates the expected length by running many trials. Each trial keeps drawing from uniform(0,1) until the next number is not larger than the previous one.
import random
import statistics

def simulate_increasing_sequence(num_trials=10_000_00):
    lengths = []
    for _ in range(num_trials):
        count = 1
        current = random.random()
        while True:
            nxt = random.random()
            if nxt > current:
                count += 1
                current = nxt
            else:
                break
        lengths.append(count)
    return statistics.mean(lengths)

avg_length = simulate_increasing_sequence()
print("Estimated expected length:", avg_length)
Running this simulation for a large number of trials will yield a result close to 1.71828, which aligns with e−1.
Follow-Up Question 4
What changes if the distribution is not uniform(0,1) but some other continuous distribution, say a normal distribution?
For any continuous distribution on the real line, the probability that two draws coincide is zero. This symmetry argument can still apply: each i-tuple of distinct values has exactly one ascending arrangement among the i! permutations. Therefore, the probability that the first i draws are strictly increasing remains 1/i!. Hence, even if we pick from a normal distribution (or any continuous distribution), the expected stopping time remains e−1.
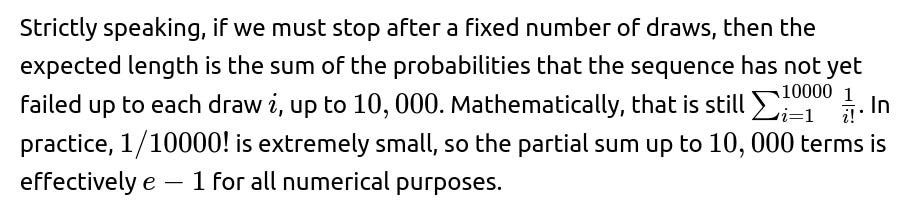
Follow-Up Question 5
What if we set a maximum number of draws, say 10,000, rather than drawing infinitely?

Below are additional follow-up questions
Follow-Up Question 1
If the draws come from a correlated sequence rather than i.i.d. samples, how does that affect the expected length?
When we say “i.i.d.”, we assume each random variable is statistically independent of the others and drawn from the same distribution. Independence is key here. If the samples are correlated, the probability that they remain in ascending order for i draws is no longer 1/i!.
Potential Pitfall: If correlation is positive, the chance that a small value is followed by another small value (and hence might stay below future draws) or that a large value is followed by another large value (risking early “breaks”) could shift the probabilities. The sequence might remain increasing longer or shorter depending on how exactly the correlation is structured.
Real-World Issue: In financial time series or sensor data, measurements are often correlated over time. The classical e−1 result would not apply without modifications.

Follow-Up Question 2
What happens if the distribution is a mixture of continuous and discrete components?
If the distribution can output the same value with a non-negligible probability, the chance of exact ties is greater than zero. This complicates the notion of “strictly increasing,” because a tie violates strict inequality.
Potential Pitfall: Even a small discrete probability mass can cause a significant number of ties, especially if that mass is at a commonly drawn value. The event “first i draws are strictly increasing” needs the values to be all distinct and in ascending order, so ties would break the chain earlier.
Real-World Issue: Sensor readings in practice might be quantized at certain levels, or data might be partly discrete (e.g., measuring certain categories) and partly continuous (e.g., real-valued error or noise).
Detailed Answer: You must compute the probability that i draws are strictly increasing under this mixed distribution. This no longer simplifies to 1/i!. You might break the distribution into a purely continuous part plus any point masses and then account for the effect of repeated values. In many real-world scenarios, the expected length of the strictly increasing run would be smaller than e−1, due to the higher chance of hitting a tie or repeated draw.
Follow-Up Question 3
How does the expected length differ if we consider a “strictly decreasing” sequence rather than “strictly increasing”?
For i.i.d. continuous random variables, the probability that i samples appear in strictly decreasing order is still 1/i!, identical to the strictly increasing case.
Potential Pitfall: One might think there is an asymmetry if the distribution is bounded below or above, but for uniform(0,1) or any continuous distribution, the probability of any one of the i! permutations still remains 1/i!.

Follow-Up Question 4
How can we derive or estimate the variance or the entire distribution (not just the mean) of the stopping time?
Up to now, we have focused on the expected value. But we might want to know how variable the length is.

Follow-Up Question 5
Could floating-point precision issues cause problems in a large-scale simulation or in high-frequency data?
If you are simulating with a large number of draws in high-dimensional scenarios, floating-point precision might cause near-equal numbers to appear effectively equal in the software environment.
Potential Pitfall: When two values are extremely close, numerical rounding might cause them to appear identical if we only store double precision. In strict theory, the probability of a tie in a continuous distribution is zero, but in actual floating-point arithmetic, you can end up with “accidental” ties.
Real-World Issue: Very large-scale computations (e.g., billions of draws in a parallel environment) might see this happen sporadically and could artificially shorten the increasing sequence.
Possible Workaround: One approach is to track differences with higher precision or to treat extremely small differences as non-ties. Another approach is to use rational approximations or arbitrary precision arithmetic if truly necessary, though that can be computationally expensive.
Follow-Up Question 6
How can we efficiently detect the exact point where the sequence ceases to be strictly increasing if we only have a stream of data and cannot store all past draws?
A naive approach might store all previous draws and compare each new draw to the entire sequence to ensure it is larger than all past values, but that is not memory-efficient for large streams.
Efficient Method: We only need to track the current maximum of all draws seen so far. Once a new draw is not greater than that maximum, the process stops. We do not need to store older draws.
Implementation Detail:
Initialize a variable
current_maxto −∞.Read the next sample
x.If
x>current_max, then updatecurrent_max = xand continue. Otherwise, stop.
Pitfall: If we allow ties to pass, we would do
>=, but for strictly increasing, it must be strictly>.Follow-Up Question 7
Does the memoryless property of the exponential distribution help in any special way, or is it irrelevant for “strictly increasing” sequences?
The memoryless property of exponential distributions is often useful in waiting-time problems or “time until event” problems. However, for a strictly increasing sequence, what matters is the relative order of the samples, not how they are spaced in time.
Detailed Explanation: Because we need the strict ordering of the sample values themselves (not times between events), the memoryless property does not simplify the probability that i samples are in increasing order. You would still rely on the 1/i! argument for distinct continuous draws. Thus, the memoryless property does not meaningfully change the expected length from e−1.
Follow-Up Question 8
Can we generalize from uniform(0,1) to any continuous distribution by applying the Probability Integral Transform, and do we always get the same expected value e−1?
Yes. The Probability Integral Transform states that if Y is drawn from a continuous cumulative distribution function (CDF) F, then U=F(Y) is uniform(0,1).
Detailed Logic: For any continuous random variable Y, you can convert each draw to U=F(Y). If F is strictly increasing on the support, U is uniform(0,1). Consequently, the ordering of the Y values is the same as the ordering of the U values. So the problem of “strictly increasing” among the Y values is exactly the same as “strictly increasing” among the U values.
Result: Thus, no matter which continuous distribution you start from, the expected sequence length for strictly increasing draws is e−1.
Pitfall: This argument breaks if F is not strictly monotonic or if the distribution has discrete atoms. Those scenarios require separate handling, as ties become non-negligible.


