
ML Interview Q Series: Explain the main distinctions between a Linear Regression model and a Decision Tree model for regression tasks


📚 Browse the full ML Interview series here.
Comprehensive Explanation
Linear Regression and Decision Trees are two widely used techniques for supervised learning, particularly in regression tasks. They operate under different assumptions about data, optimization strategies, and how they represent the underlying function mapping from inputs to outputs.
Core Mathematical Representation of Linear Regression
Linear Regression typically assumes a linear relationship between the features and the target. A standard form of the hypothesis function for a univariate or multivariate Linear Regression problem can be written as:
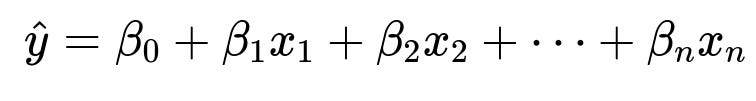
Here:
beta_0 is the intercept term (often referred to as the bias).
beta_1 through beta_n are the coefficients (weights) corresponding to the features x_1 through x_n.
x_1 through x_n represent the feature values for a given data point.
hat{y} is the predicted target value for a given data point.
Linear Regression finds these coefficients (beta_i) by minimizing a loss function, which is often the sum of squared errors between the predictions and the true labels. This approach works best if the data truly follows, or approximately follows, a linear relationship in feature space.
Decision Tree Structure
A Decision Tree uses a hierarchical, tree-like structure where data is split recursively based on specific thresholds of feature values. Each node in the tree selects a feature and a threshold that (ideally) reduces the prediction error the most (e.g., mean squared error reduction in a regression setting). The process continues until a stopping criterion is met (like a maximum depth, minimum samples in a leaf, or purity threshold). Decision Trees effectively segment the feature space into rectangular regions where each leaf node corresponds to a constant prediction (often the mean of the target values in that leaf).
Model Complexity and Expressiveness
A Linear Regression model is simple and assumes a linear (or a polynomial if manually engineered) relationship between inputs and outputs. In contrast, a Decision Tree can capture highly nonlinear relationships by virtue of its splitting process. However, Decision Trees can easily overfit if allowed to grow without proper regularization, while Linear Regression (especially with regularization such as Ridge or Lasso) tends to be more stable if the linear assumption holds.
Interpretability
Linear Regression has coefficients that directly indicate how much each feature contributes to the final prediction in a linear sense. Decision Trees also have a certain interpretable structure: one can follow the branches to see which conditions lead to a particular prediction. But as the tree depth grows, the interpretability can become more complicated compared to the straightforward linear coefficients in Linear Regression.
Sensitivity to Outliers and Noise
Linear Regression can be strongly affected by outliers, as large deviations can disproportionately affect the sum of squared errors. Decision Trees are generally more robust to outliers because splits are made based on thresholds; extreme values might just end up isolated in their own leaf node.
Training Time and Data Requirements
Training a simple Linear Regression model is computationally efficient, usually involving closed-form solutions (Normal Equation) or iterative methods (Gradient Descent). Decision Trees use a greedy algorithm to find optimal splits at each node, and while they are typically quite fast in many contexts, growing a deep tree can sometimes be more expensive than fitting a small or medium-sized linear model. If the true data distribution is linear and you do not have a large training set, Linear Regression can work efficiently. If the relationship is highly nonlinear with sufficient training data, a Decision Tree might capture these patterns better.
Overfitting and Generalization
Linear Regression can underfit if the relationship between features and target is nonlinear. Decision Trees can overfit by memorizing training data through very deep branches. Techniques such as pruning or setting a max depth help reduce Decision Tree overfitting. For Linear Regression, one can use regularization methods (Ridge, Lasso, Elastic Net) to improve generalization.
Example Implementation in Python
import numpy as np
from sklearn.linear_model import LinearRegression
from sklearn.tree import DecisionTreeRegressor
from sklearn.model_selection import train_test_split
from sklearn.metrics import mean_squared_error

# Example Data
X = np.array([[1], [2], [3], [4], [5], [6]]).astype(float)
y = np.array([2, 4, 5, 4, 5, 7]).astype(float)

# Splitting into train and test
X_train, X_test, y_train, y_test = train_test_split(X, y, test_size=0.3, random_state=42)

# Linear Regression
lin_reg = LinearRegression()
lin_reg.fit(X_train, y_train)
lin_pred = lin_reg.predict(X_test)
lin_mse = mean_squared_error(y_test, lin_pred)

# Decision Tree
tree_reg = DecisionTreeRegressor(max_depth=2, random_state=42)
tree_reg.fit(X_train, y_train)
tree_pred = tree_reg.predict(X_test)
tree_mse = mean_squared_error(y_test, tree_pred)

print("Linear Regression MSE:", lin_mse)
print("Decision Tree MSE:", tree_mse)
This example provides a simple illustration of how to train and evaluate both Linear Regression and a Decision Tree using scikit-learn.
Possible Follow-up Questions
How would you choose between these models if the data has a highly nonlinear relationship?
In scenarios where the relationship between the features and target is clearly nonlinear, a Decision Tree can naturally segment feature space into intervals to capture these complex patterns. Linear Regression would require explicit feature engineering (e.g., adding polynomial terms or other transformations) to handle such nonlinearity. Thus, if there is limited domain knowledge about the nature of the relationship, a Decision Tree (or ensemble methods like Random Forests) can capture nonlinearities with fewer manual adjustments.
How do you mitigate overfitting with these two models?
For Linear Regression, overfitting can often be handled by applying regularization techniques like Ridge (L2 penalty) or Lasso (L1 penalty), which penalize large coefficient values. For Decision Trees, common techniques include pruning, specifying a maximum tree depth, or requiring a minimum number of samples in each leaf node. These constraints reduce the model’s tendency to simply memorize training data.
What if some features are missing data or have outliers?
Linear Regression typically requires careful preprocessing, including imputation for missing values and potentially the removal or transformation of outliers. Decision Trees, on the other hand, can handle outliers more gracefully by isolating them in their own leaf nodes and are somewhat more robust. However, if a feature is missing values frequently, you still need an imputation strategy, though some tree implementations can handle missingness more gracefully by splitting data into “missing” vs. “non-missing” as well.
Are there scenarios where feature scaling is critical for each model?
Linear Regression is sensitive to the scale of features, because large-valued features can disproportionately affect the cost function. It is often beneficial to scale or normalize features before applying linear methods. Decision Trees are invariant to monotonic transformations of the features (like min-max scaling), because splits are based on relative ordering of feature values. Feature scaling typically does not affect a decision tree’s structure or performance significantly.
What are the major interpretability differences between the two?
Linear Regression has direct coefficients that quantify the effect of each feature on the target (assuming features are reasonably independent from each other). This can be useful for understanding how changes in a single feature might affect predictions. Decision Trees can be interpreted by examining the path from the root node to a leaf, which tells you the sequence of split conditions leading to a final prediction. However, deeper trees can become less transparent because of the many branches. On balance, a simple linear model with a few features is usually more straightforward to interpret, while a shallow decision tree is also interpretable but can become complex as depth increases.