
ML Interview Q Series: Explain what is an Unrepresentative Dataset and how would you diagnose it?

📚 Browse the full ML Interview series here.
Comprehensive Explanation
An unrepresentative dataset is one whose distribution of examples does not reflect the true data distribution we want to model. In other words, the data we have collected or used for training do not mirror the real-world scenarios in which the model will operate. This usually happens because of sampling biases, undercoverage of key sub-populations, or unintentional skewing of certain categories. If our dataset is unrepresentative, then even the best-trained model can fail to generalize well because it has never “seen” the true variety of examples it will face in production.
When the distribution of the training dataset significantly differs from the real-world data distribution (for example, the distribution in the test set or in live production data), we have a dataset mismatch problem. This mismatch can lead to consistently poor performance, bias against certain categories, and incorrect predictions because the model’s learned patterns are not relevant or are incomplete compared to actual real-world usage.
Diagnosing Unrepresentative Datasets
Data distributions can be examined visually or statistically to check whether the training sample represents the target population. In practice, one common approach is to compare the distribution in training data vs. the distribution in a well-collected validation or test data that more closely reflects the real-world environment.
Comparing Distributions
If you have access to two datasets, P(x) for training and Q(x) for what you believe is the “true” data distribution (or at least a more representative sample), you can measure their difference using metrics such as KL divergence or other distance measures (e.g., JS divergence, Earth Mover’s Distance). KL divergence is a common theoretical approach, although in practice you might employ more robust or numerically stable methods.
Below is a core formula used to measure a difference between distributions (here, to get a sense of how unrepresentative one dataset might be compared to another). This can help in diagnosing if your training set is missing or over-representing certain segments:
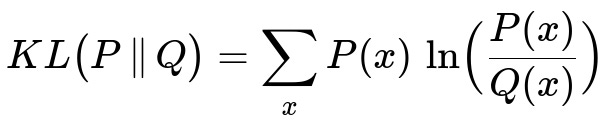
Where:
P(x) in inline text is the probability of data point x in the training dataset distribution.
Q(x) in inline text is the probability of the same data point x in the true or representative distribution.
KL divergence is computed over all possible x in inline text. Higher values indicate a larger difference between the two distributions.
In reality, you may approximate P(x) in inline text and Q(x) in inline text via histograms or density estimates, then compute the sum over the possible bins or categories. In more continuous spaces, you would estimate densities using kernels, parametric approximations, or other density estimation techniques.
Another simpler, more direct approach involves comparing descriptive statistics (like means, variances, frequency counts) across the two datasets. If these differ significantly, it suggests the training set may not be representative.
Qualitative and Exploratory Analysis
Sometimes, just looking at the raw dataset can quickly reveal representativeness issues. For example, if you are building a face recognition system but your dataset is 80% images of light-skinned individuals, that is a red flag that it is not representative of the broader population. Exploratory data analysis (EDA) can highlight potential missing subpopulations, severe class imbalance, or unusual sampling procedures.
Domain Expertise Checks
Most data collection processes have nuances. You should consult domain experts or those who know how the data was gathered to confirm whether certain groups might be missing or under-represented. For instance, if data came from a specialized channel (like only one geographic region or only certain times of the year), it may not represent other relevant contexts.
Potential Solutions
If you discover unrepresentativeness, some potential fixes include:
Collecting additional data that better reflects your desired population.
Using sampling techniques such as stratified sampling to ensure the distribution of classes matches real-world proportions.
Employing weighting or data augmentation so that under-represented classes appear more prominently during training.
Practical Example of Distribution Checking
Below is a simple Python snippet that compares histograms of two datasets to diagnose if they might differ significantly. Suppose we have feature age in both a training dataset and a validation dataset:
import numpy as np
import matplotlib.pyplot as plt

# Suppose these are age columns from training and validation sets
train_ages = np.random.randint(18, 60, size=1000)  # Example training data
valid_ages = np.random.randint(18, 60, size=1000)  # Example validation data

# Plot histograms for visual comparison
plt.figure(figsize=(10, 4))
plt.hist(train_ages, bins=range(18,61), alpha=0.5, label='Training')
plt.hist(valid_ages, bins=range(18,61), alpha=0.5, label='Validation')
plt.legend()
plt.title("Distribution of Ages in Training vs Validation")
plt.xlabel("Age")
plt.ylabel("Frequency")
plt.show()
If the shapes of the distributions appear radically different (for example, if training_ages are mostly in the 18–30 range, whereas validation_ages are mostly in the 40–60 range), that is a sign of an unrepresentative dataset.
Follow-up Questions
How do you handle situations in which your test or validation set might also be unrepresentative?
In some cases, even the test set might fail to represent the real-world scenarios (for example, if the test set was created under lab conditions different from production). The best approach is to obtain a dataset that truly mirrors the deployment environment. Sometimes, it means creating multiple test sets, each reflecting a different slice or region of the application domain. This helps you pinpoint where unrepresentativeness lies—be it in the training set, the test set, or both.
What if collecting new representative data is difficult or expensive?
When new data collection is too costly, you might try:
Weighting or re-sampling your current data to artificially adjust its distribution. This can partially mitigate mismatch if you have at least some examples of each scenario but in different proportions than reality.
Using domain adaptation techniques, which try to adapt a model from one distribution to another. This can include unsupervised or semi-supervised approaches if labeled data in the target domain is scarce.
Introducing synthetic data generation or data augmentation if it is appropriate for your domain. However, you must ensure that synthetic data accurately reflects real-world variations.
How can you confirm that your model truly suffers due to unrepresentativeness and not some other issue?
You can compare performance on different slices of your data. If there is a specific region where performance is poor, it might be due to under-representation of that region in the training set. You can also:
Perform cross-validation with carefully selected folds.
Check performance metrics (precision, recall, accuracy) on subgroups of the data to see where the model fails.
Use fairness metrics or other advanced metrics if you suspect certain demographic groups are being misrepresented.
Are there any statistical tests for checking unrepresentativeness?
Aside from visual inspection or KL divergence, you can perform hypothesis tests like the Chi-square test for categorical distributions. For continuous variables, you can use the Kolmogorov–Smirnov (KS) test or Anderson–Darling test to see if two samples come from the same underlying distribution. Large deviations in these tests indicate potential unrepresentativeness.
What real-world pitfalls often occur with unrepresentative datasets?
In practice, it is common to gather data from easily accessible sources rather than from sources that truly reflect the final usage pattern. This might be a matter of convenience or historical data collection limits. Another pitfall is ignoring how the environment can change over time, making data that was once representative become obsolete. It is crucial to continuously monitor the input distribution in production and compare it with the training distribution to detect shifts or drifts.
Such monitoring can be done with drift detection tools that regularly measure divergence. If a drift is detected, you might need to retrain the model or collect more up-to-date data.
Below are additional follow-up questions
How do you measure the impact on fairness and potential bias when dealing with unrepresentative datasets, and how can you mitigate those ethical concerns?
One common pitfall of unrepresentative datasets is inadvertently introducing or amplifying biases against specific sub-populations. Even if performance metrics look good on average, certain groups may receive systematically worse predictions. To measure the impact of fairness and detect bias:
Metric-based Assessment You can evaluate fairness with metrics such as demographic parity difference, equalized odds, or disparate impact. These metrics quantify how different protected groups (e.g., gender, ethnicity, age groups) fare under your model’s predictions.
Subgroup Performance Analysis Break down model performance by subgroup—e.g., check precision, recall, F1-score for each demographic category or region. If one subgroup has significantly lower performance, it might indicate bias or under-representation in the training data.
Mitigation Techniques
Collect Balanced Data: Acquire more data from under-represented groups, if feasible.
Algorithmic Adjustments: Employ reweighing or debiasing methods that adjust decision thresholds for different groups.
Post-processing: Calibrate probabilities or adjust predictions after the model is trained to meet certain fairness criteria.
A subtle real-world issue arises when fairness constraints conflict with maximizing overall accuracy. For instance, raising recall for a minority group might slightly reduce overall accuracy. Such trade-offs highlight the need for careful stakeholder discussions to prioritize social and ethical considerations alongside performance metrics.
How would you address unrepresentative data in a time-series context, especially when distributions shift over time?
Time-series data often exhibit non-stationarity, meaning the distribution of observations (or target labels) changes over time. This can invalidate assumptions that older historical data are representative of future data.
Rolling Window Validation Use rolling-window or expanding-window evaluation so that your validation sets reflect the chronological order in which data appear in production. This setup helps identify if older segments of data differ substantially from more recent segments.
Trend and Seasonality Analysis Check for strong periodic behaviors, such as weekly or seasonal patterns, that can produce distribution shifts. If your training data do not capture these phenomena, your model will perform poorly.
Adaptive or Online Learning Retrain or fine-tune the model at regular intervals with the most recent data. Online algorithms can learn incrementally or be adapted quickly when new data distribution changes are detected.
An edge case is when an abrupt shift (e.g., an external event) drastically changes the data generating process. In such scenarios, older data might become partially or entirely irrelevant. You must then rely heavily on post-change data, or use domain knowledge to adjust for the new regime.
Are there advanced sampling or weighting strategies for correcting unrepresentative distributions, and how can they be applied in practice?
If you have access to at least some data from each critical sub-population, you can often compensate for unrepresentativeness through weighting or resampling.
Inverse Probability Weighting Suppose each instance has a known probability p_i of appearing in the dataset if it were truly representative. You can assign a weight w_i = 1 / p_i to that instance during training. Intuitively, samples that are harder to observe should have higher weight to compensate for their under-representation.
Oversampling / Undersampling
Oversampling: Duplicate under-represented samples or synthetically generate them (e.g., SMOTE for tabular data).
Undersampling: Randomly remove over-represented samples. This might risk discarding potentially useful data, so you must do it carefully.
Stratified Sampling Segment your dataset into strata (e.g., by class label or demographic group) and then sample from each stratum proportionally to the real-world distribution you want.
A subtle pitfall arises when you have only a sparse set of examples from a particular group, and you oversample them too aggressively. You risk overfitting to just a handful of minority examples, leading to poor generalization. Balancing sampling techniques with robust cross-validation is essential to mitigate this risk.
In a production environment, how do you monitor whether the incoming data is representative compared to what the model was trained on?
After deployment, data drift is inevitable. You need robust tools and processes to detect if production data differ significantly from training data.
Real-time Distribution Monitoring Track feature distributions (mean, variance, and histograms) and compare them with the training distribution. If the difference exceeds a certain threshold, trigger an alert.
Drift Detection Algorithms Use statistical tests such as Kolmogorov–Smirnov or more advanced drift detection methods (e.g., ADWIN, DDM, or KS-win for streaming data). They detect changes in distribution over time.
Performance Degradation Checks Keep a small subset of labeled examples from production (if available) or track feedback metrics (like user click-through rates). A sudden drop in performance can signal that the new data no longer resemble the training data.
An edge case arises if some subgroups are rarely present in production logs, making it challenging to track their metrics. You may need specialized logging or active sampling of less common groups to ensure you do not overlook distribution shifts for them.
How do you handle unrepresentative data for extremely high-dimensional inputs, such as images or text?
High-dimensional spaces (computer vision, NLP) exacerbate unrepresentativeness issues because there are infinitely many potential variations of the data.
Data Augmentation
Images: Apply transformations like random cropping, flipping, rotation, or color jittering to simulate variations that the dataset may not fully capture.
Text: Use synonym replacement, back-translation, or domain adaptation techniques to capture broader linguistic patterns.
Pretrained Models For deep learning, use pretrained backbones (e.g., large language models or CNNs pretrained on massive datasets). These networks often generalize better to new domains, even if your dataset is small or somewhat skewed.
Active Learning Identify uncertain or misclassified examples and request more labeled data specifically in these high-dimensional “blind spots.” This approach can systematically expand coverage of under-represented variations.
One subtlety is that augmentation might introduce artifacts not present in the real data (for example, an aggressive random rotation that creates unnatural images). Overusing such augmented data can mislead the model. You must balance augmentation diversity with realism.
What if your data is representative of the current environment, but you expect major changes in the future?
Predictive models often need to remain stable even as real-world conditions evolve. This scenario is common in consumer-facing products or rapidly changing markets.
Forward-looking Features and Scenario Analysis Use domain knowledge to hypothesize how changes might manifest and create synthetic or scenario-based data that represent those future states. This helps you test how your model might behave under changed conditions.
Model Retraining on Fresh Data Continuously retrain the model on the most recent data or maintain rolling windows that capture short-term trends. This approach helps keep the model from becoming outdated.
Hybrid Models Combine stable historical patterns with real-time signals or specialized modules that adapt quickly. For example, a system that uses a base model for broad predictions but fine-tunes on new data for short-term accuracy might handle an evolving environment more gracefully.
A risk arises if you rely too heavily on hypothetical future scenarios. If those scenarios are not accurate, you could distort your model’s learning. You must pair scenario-based methods with active monitoring of production data to validate assumptions.
How do you approach a scenario where your dataset is partially representative overall, but you are missing a critical sub-population because of privacy or regulatory restrictions?
Sometimes, regulations prevent you from collecting data on certain demographics or personal information, making it hard to ensure representation of those groups.
Proxy Variables If you cannot collect direct information (e.g., race), you may find legal or ethical proxy variables that partially capture the sub-population’s characteristics. This is delicate—using the wrong proxy can introduce or perpetuate bias.
Collaboration with Regulatory Bodies Seek ways to anonymize or aggregate data that might otherwise be restricted. For instance, a carefully designed third-party system might hold sensitive data and only provide aggregated statistics, ensuring compliance.
Fairness-Aware Methods without Direct Labels Some fairness algorithms allow you to try to ensure balanced treatment across clusters in feature space, even if you do not have explicit demographic labels. These unsupervised or semi-supervised approaches group similar individuals and enforce fairness constraints.
A key pitfall is that proxies or aggregated data can sometimes be inaccurate or incomplete, leading to false assumptions about real sub-populations. You might unintentionally overcorrect or undercorrect for certain groups if your proxies are not well aligned with reality. Balancing privacy with representativeness requires close collaboration with legal teams, domain experts, and end-users.