
ML Interview Q Series: How are k-Means clustering and Principal Component Analysis connected to one another?


📚 Browse the full ML Interview series here.
Comprehensive Explanation
k-Means clustering and Principal Component Analysis (PCA) both involve understanding and leveraging variance within a dataset, though they do so in different but often complementary ways. They are sometimes combined because reducing dimensionality before or after applying k-Means can yield clearer cluster separation, improved clustering performance, or easier visualization.
Underlying Objectives
Both techniques aim to capture or group data according to patterns of variation. PCA focuses on directions (principal components) that capture the largest variance, while k-Means seeks centroids that minimize the sum of squared distances from data points to their respective cluster centers. Below is the central objective function for k-Means:
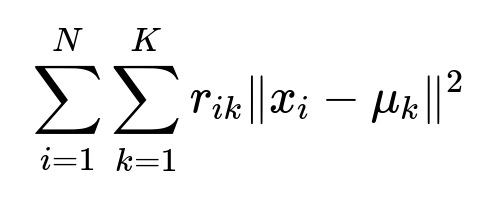
Here, N is the total number of data points, K is the number of clusters, r_{ik} is an indicator that is 1 if data point x_{i} belongs to cluster k and 0 otherwise, and mu_{k} is the centroid (mean) of cluster k. The goal is to assign each x_{i} to the nearest centroid mu_{k} and update the centroids to minimize the overall sum of squared distances.
PCA, on the other hand, often involves solving for the directions that maximize variance or equivalently minimize reconstruction error in a lower-dimensional subspace. Although both tasks rely on variance and squared errors, PCA is an unsupervised dimensionality reduction technique, whereas k-Means is an unsupervised clustering algorithm.
Geometric Interpretation
k-Means tries to partition the dataset into K groups such that the groups are as compact as possible. PCA reorients the dataset to align with directions of maximal spread. When PCA is performed, the transformed coordinates can reveal more pronounced structure in fewer dimensions, which can help k-Means produce more distinct clusters.
When applying PCA before k-Means, we project the data onto the first few principal components. These components have the largest variance, potentially making cluster structure more evident. This can reduce noise coming from weaker directions of variance, hence facilitating clearer separation when clustering.
Practical Usage
In practical scenarios, one might first apply PCA to reduce high-dimensional data to a more manageable dimension, and then run k-Means on the transformed data. This can speed up computations and may improve clustering performance. Similarly, interpreting clusters in the space of the principal components can provide insights into which latent factors (i.e., principal axes) are driving the clustering result.
Trade-Offs and Considerations
One should consider that PCA is a linear transformation and might not capture complex nonlinear relationships in data. If the original data’s structure is heavily nonlinear, PCA might not preserve the cluster patterns well. Also, choosing how many principal components to retain involves a balance between retaining enough variance to meaningfully cluster the data versus removing noise and unnecessary complexity.
Combining PCA and k-Means
A common pipeline is:
Scale the data if features are on widely different scales.
Use PCA to reduce dimensionality.
Choose the number of principal components such that sufficient total variance is retained.
Run k-Means on the lower-dimensional representation.
Evaluate cluster separation using metrics such as Silhouette Score, Calinski-Harabasz Index, or Davies-Bouldin Index.
Below is a brief Python example illustrating how to integrate PCA and k-Means:
import numpy as np
from sklearn.decomposition import PCA
from sklearn.cluster import KMeans
from sklearn.datasets import make_blobs
from sklearn.preprocessing import StandardScaler

# Generating synthetic data
X, y_true = make_blobs(n_samples=500, centers=5, n_features=10, random_state=42)

# Standardize features
scaler = StandardScaler()
X_scaled = scaler.fit_transform(X)

# Apply PCA for dimensionality reduction
pca = PCA(n_components=2)
X_pca = pca.fit_transform(X_scaled)

# k-Means clustering on PCA-transformed data
kmeans = KMeans(n_clusters=5, random_state=42)
kmeans.fit(X_pca)

# Cluster centers (in PCA space)
centers = kmeans.cluster_centers_
print("Cluster centers in PCA space:", centers)

# Predicted cluster labels
labels = kmeans.labels_
print("Cluster labels:", labels[:10])
Here, data with 10 features is first standardized and then projected onto the top 2 principal components. k-Means is run on the transformed data, potentially leading to better cluster quality than directly clustering in 10-dimensional space.
Potential Follow-Up Questions
Why does PCA often improve the performance of k-Means clustering?
PCA eliminates dimensions that contribute minimal variance, reducing noise in the data. When fewer dimensions with higher explanatory power remain, the Euclidean distance calculations used by k-Means can become more meaningful.
Can PCA ever harm k-Means clustering performance?
If important cluster structure lies in lower-variance dimensions or if the data is very nonlinear, PCA might discard helpful information. The linear nature of PCA can sometimes obscure certain types of separations that k-Means would otherwise detect in the original high-dimensional space.
Are there times when one should not perform PCA prior to k-Means?
When the goal is interpretability of the clusters in terms of the original feature set, applying PCA first makes it harder to map cluster assignments back to original features. Additionally, if the dataset has few features or if the variance in the full dimensional space is already well-aligned with the clusters, PCA might not add any value.
How does the minimization problem in k-Means relate to PCA in a mathematical sense?
Both can be viewed through the lens of least-squares and variance capture. k-Means minimizes within-cluster variance, while PCA maximizes explained variance along new axes. Though the objectives are distinct, both revolve around analyzing variance using squared distances, and there are analytical links between cluster centroids and low-dimensional representations (such as performing SVD on cluster-based data matrices).
How does one choose the correct number of principal components or clusters?
These are hyperparameters that often require domain knowledge or empirical tuning:
For PCA, methods like the Scree plot or cumulative variance threshold can help decide how many principal components to keep.
For k-Means, the Elbow method or Silhouette Score can help determine an appropriate number of clusters.
By combining PCA’s dimensionality reduction with k-Means clustering, it is possible to make the clustering procedure more effective, interpretable (in terms of key latent directions of variance), and computationally efficient.