
ML Interview Q Series: How can Standard Deviation be applied to detect anomalies in a dataset?


📚 Browse the full ML Interview series here.
Comprehensive Explanation
One common approach to anomaly detection involves using the statistical properties of your data—in particular, the mean and the standard deviation. You assume that data points far from the mean (beyond a certain threshold) may be considered anomalies. The underlying intuition is that under many real-world conditions, data is reasonably close to a normal (or at least unimodal) distribution, so points lying many standard deviations away might be unusual or suspicious.
When applying this method, you:
Compute the mean of the data.
Compute the standard deviation.
Decide on a threshold
k(for instance 2, 3, or 4). If a data point is more thankstandard deviations above or below the mean, you flag it as an outlier.
Below is the mathematical expression for the sample standard deviation that is typically central to this method:
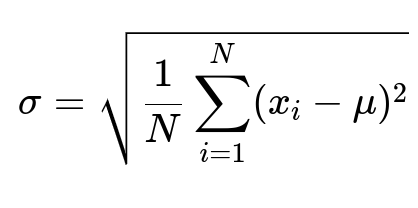
Here, x_i in text denotes the i-th data point, N in text is the total number of data points, mu in text is the mean of all data points, and sigma in text is the standard deviation. A data point that differs significantly from the mean (for example, beyond 3 * sigma in text) can be treated as an anomaly.
Practical Example in Python
import numpy as np

# Suppose we have some dataset
data = np.array([10, 12, 13, 15, 14, 100, 11, 12, 13, 15])

mean = np.mean(data)
std_dev = np.std(data)

# Choose a threshold, say 3 standard deviations
threshold = 3

anomalies = []
for x in data:
    # Check if x is outside the mean ± threshold * std_dev
    if (x < mean - threshold * std_dev) or (x > mean + threshold * std_dev):
        anomalies.append(x)

print("Mean:", mean)
print("Standard Deviation:", std_dev)
print("Anomalies:", anomalies)
In this snippet:
We compute the mean of data.
We then compute the standard deviation.
We consider any point that lies outside mean ± 3 * standard_deviation to be anomalous.
This simple approach relies heavily on the assumption of a roughly normal distribution. If the data is highly skewed or follows a heavy-tailed distribution, you might need more robust measures of spread (like the median absolute deviation) or alternative anomaly detection techniques.
What if the data is not normally distributed?
If your data does not follow a normal distribution, using the mean and standard deviation for anomaly detection may be misleading. Long-tailed distributions, for instance, naturally exhibit outliers in the tail. In those cases, standard deviation-based rules might either over-flag or under-flag anomalies. A possible solution is to apply transformations (like the log transform) if the data is strictly positive and heavily right-skewed. Alternatively, you might use more robust statistics, such as median and median absolute deviation, or you could use more sophisticated algorithms (like Isolation Forest or DBSCAN).
How do we pick the threshold (k) for flagging anomalies?
Choosing the threshold k is often domain-dependent. Some typical values are 2, 3, or 4. For instance, in a normal distribution, about 99.7% of data lies within 3 standard deviations of the mean (the 68-95-99.7 rule). Hence, picking k = 3 is a standard choice, but if you need stricter control, you might use 4 standard deviations or more. However, the best strategy is to experiment with different k values and assess how many points you classify as anomalies, then verify whether those points are truly unusual in a real-world context.
Are there any edge cases where using standard deviation alone fails?
Yes, there are multiple edge cases:
Small datasets. If the dataset is too small, the estimated mean and standard deviation might be unreliable.
High-dimensional data. When dealing with many features, the concept of distance from the mean (in a Euclidean sense) might not adequately capture abnormality due to the “curse of dimensionality.”
Presence of multiple clusters. If the dataset naturally has multiple clusters, a single global mean and standard deviation might not reflect each cluster’s local behavior. You might need more cluster-specific anomaly detection methods.
Extreme outliers. If there are extreme outliers in the data, they can inflate the standard deviation, making other moderate anomalies appear less pronounced.
How can we handle anomalies after detecting them?
After finding anomalies, possible actions include:
Removing them from the dataset if they are spurious data-collection errors.
Imputing them with more plausible values if they’re suspected measurement artifacts but are not truly relevant for modeling.
Investigating them deeper, as in many domains (like network security or fraud detection), anomalies can reveal important insights or intrusions.
Can we detect anomalies in a streaming context using standard deviation?
Yes. You can adopt an online approach to keep a running estimate of the mean and standard deviation. Each time a new data point arrives, you update your estimates. There are known algorithms (e.g., Welford’s method) for efficiently computing an online mean and variance. You then check the new point against the updated mean ± k*std_dev. This is useful in real-time applications where data arrives continuously.
How would we implement a rolling anomaly detection?
For time-series data, you might look at rolling windows. You compute the mean and standard deviation over a fixed-size recent window, then detect anomalies relative to that window’s statistics. This approach captures changes in the behavior of the system over time. If the process has non-stationary behavior (the mean or variance changes gradually), rolling windows help adapt to those changes better than a static global mean and standard deviation.
Would robust alternatives to standard deviation help?
Yes. The median absolute deviation (MAD) is a more robust measure for central tendency and spread. Sometimes, a single outlier can bias your mean or standard deviation, but the median and MAD are less affected by outliers. When your data contains a few extreme points but is otherwise normal, you might get more stable anomaly detection performance using robust methods.
Is it possible to combine standard deviation-based detection with other methods?
Absolutely. You can blend standard deviation-based detection with clustering approaches, density-based detection, or model-based methods. In ensemble anomaly detection, multiple detectors are used, and then the results are combined. This reduces the risk of overfitting to a single technique’s assumptions and often gives better overall anomaly detection performance.
These points illustrate typical follow-up discussions in FANG-level interviews, ensuring you fully understand the nuances and practical considerations of using standard deviation for anomaly detection.
Below are additional follow-up questions
Could outlier definitions vary if different features in the dataset are on wildly different scales?
When different features exist on very different scales, a single global threshold for what counts as an “outlier” may be misleading. For example, one feature might vary in the range of 0 to 1, whereas another might vary from 1,000 to 10,000. If you apply the same k * standard_deviation across all dimensions without scaling or normalizing, you could erroneously classify normal values in the smaller-scaled feature as outliers, or miss true anomalies in the larger-scaled feature. A common practice is to standardize each feature (subtract mean and divide by standard deviation) before applying a standard deviation–based threshold. Alternatively, you could use a more advanced method that considers each feature separately or uses a distance measure that accounts for different scales. A pitfall is that if you standardize blindly, you might lose interpretability in certain domains where the absolute scale has specific significance.
How can multi-modal distributions challenge the use of standard deviation-based anomaly detection?
If the dataset contains more than one cluster or mode, calculating a single mean and standard deviation across the entire dataset will fail to capture the multiple “centers” of the distribution. Points that are perfectly normal in one cluster might appear far from the global mean if that cluster is offset from the overall centroid. This leads to false positives for data that just belong to a smaller or more distant cluster. One edge case is when clusters vary greatly in variance; a single global sigma could overlook the tighter clusters. A solution could be to cluster the data first (for example, with k-means or Gaussian Mixture Models), then use standard deviation–based detection within each cluster. Alternatively, you could adopt more localized anomaly detection methods (e.g., Local Outlier Factor) to handle multi-modal data effectively.
In cases of high-dimensional data, what specific issues arise using standard deviation-based methods?
High-dimensional data introduces what’s known as the “curse of dimensionality,” where distances tend to become less meaningful as dimensionality grows. When you compute a mean vector and a covariance matrix (or even just a standard deviation for each dimension independently), you risk encountering extremely large or tiny distance values that do not necessarily reflect true anomalies. Moreover, high correlations among features can mask certain outliers or create ill-conditioned covariance matrices if you go beyond the simple univariate standard deviation approach. One potential pitfall is that many data points might end up appearing similar in high-dimensional space, making standard deviation-based cutoff strategies yield large numbers of false positives or false negatives. Dimensionality reduction (such as PCA or autoencoders) followed by a univariate or multivariate anomaly detection approach can help, but you must be careful with interpretability: after dimensionality reduction, it might not be clear which original feature contributed to an outlier score.
How could seasonality or recurring patterns in time series data affect standard deviation-based anomaly detection?
Standard deviation–based methods assume that the mean remains relatively stable over time. In a time series with strong seasonality or cyclical fluctuations (such as daily or weekly repeated patterns), a single global mean and standard deviation might label normal peaks or troughs as anomalies. For instance, typical traffic spikes on a website during weekends might appear far from the mean if you calculate it for the entire month. The subtlety here is that a repeated seasonal pattern can inflate the variance, or if the pattern is abrupt but periodic, it could trigger false alarms. A more robust approach is to model or remove seasonality first—through methods like differencing, decomposition, or using a rolling window specifically aligned with the seasonal period. This helps you adjust the threshold dynamically, capturing the expected fluctuations while still highlighting truly abnormal deviations.
Is it possible that using standard deviation thresholds can result in excessive false positives if the dataset is small?
Yes. With a very small dataset, your estimates of mean and standard deviation might not be reliable. A single outlier can drastically shift the mean or inflate the standard deviation, causing suboptimal thresholds. In such scenarios, your outlier detection could be too sensitive (flagging too many normal points as anomalies) or not sensitive enough (if a single large outlier inflates the standard deviation so much that moderate anomalies appear relatively insignificant). One strategy is to use robust estimation methods—like the median and median absolute deviation, or bootstrap methods to get confidence intervals for your estimates. Another approach is domain-specific knowledge to verify or override borderline cases, since purely statistical methods may fail if the sample size is not representative of the true distribution.
How might standard deviation-based anomaly detection lead to underestimating the cost of false negatives in sensitive applications?
In certain high-stakes scenarios (e.g., fraud detection, medical diagnosis, industrial fault detection), missing a genuine anomaly (false negative) can be costlier than incorrectly flagging something that turns out to be normal (false positive). Standard deviation-based methods often use a symmetrical threshold around the mean, which can ignore the asymmetric cost of misclassification. For example, if you suspect that high measurement values in an industrial sensor are critical anomalies, you might want a more stringent threshold on the upper side than on the lower side. A potential pitfall is applying a symmetrical threshold in a domain where you only care about one-sided deviations. A remedy is to set separate thresholds for the upper and lower bounds, each tailored to the domain’s tolerance for risk, or adopt cost-sensitive approaches that incorporate the relative severity of each type of error.
Does standard deviation-based anomaly detection work effectively with heavily skewed distributions?
Heavily skewed distributions—such as log-normal—can cause the mean to shift toward outliers in the long tail, and thus inflate the standard deviation. You might see an actual outlier far out in the tail that does not exceed your threshold because the long tail makes the distribution’s variance quite large. As a result, you fail to catch genuinely anomalous points (false negatives). The edge case is that the data’s “long tail” is legitimate behavior for certain observations (e.g., income data in economics). A typical solution is to transform the data, for example using log transform if the data is strictly positive, or apply more robust measures, like using the median and an adjusted measure of spread (e.g., median absolute deviation). In practice, testing different transformations and verifying with domain knowledge is essential so you do not overcorrect normal tail behavior.
How can we ensure that domain knowledge is incorporated when using standard deviation for anomaly detection?
Relying solely on a statistical threshold might ignore crucial domain insights. For example, in healthcare data, a certain biomarker could be critical in a specific range, and even small deviations might be alarming. Standard deviation–based methods only label points as anomalies if they are multiple sigmas away from the mean, potentially overlooking subtle but important shifts. One way to integrate domain knowledge is to define separate thresholds for particular ranges or certain features that domain experts know are critical. You might also weigh features differently if the cost of an anomaly in one feature is higher than in others. The pitfall is that domain knowledge can be partial or subjective. Proper collaboration with subject-matter experts and iterative refinement of thresholds ensures a balanced approach between pure statistical techniques and real-world requirements.