
ML Interview Q Series: How can we investigate the impact of extra push notifications on overall user engagement and unsubscribes?

📚 Browse the full ML Interview series here.
Comprehensive Explanation
A key consideration is that an increase in unsubscribes could indicate user fatigue or annoyance with too many notifications. However, there might also be positive effects, such as higher engagement among certain user segments who find these alerts relevant. To thoroughly understand the impact of the new notification system on user engagement, it is critical to design the experiment and subsequent analysis in a way that clearly disentangles correlation from causation. Because there is a control (those receiving the older notification system) and a treatment (those receiving more frequent notifications), it becomes possible to perform a robust statistical analysis and segment users by various attributes.
One effective first step is to measure whether the difference in unsubscribe rates between treatment and control groups is statistically significant. For example, if p_t is the proportion of unsubscribes in the treatment group and p_c is the proportion of unsubscribes in the control group, then the simplest starting point is to consider their difference:
Here, p_t is the fraction of users in the treatment group who unsubscribed, and p_c is the fraction in the control group who unsubscribed. A significantly positive difference would suggest that the new system is increasing unsubscribes. In an A/B test framework, you would then typically conduct a significance test to check whether this difference likely arises by chance. A z-test for difference in proportions can be used:
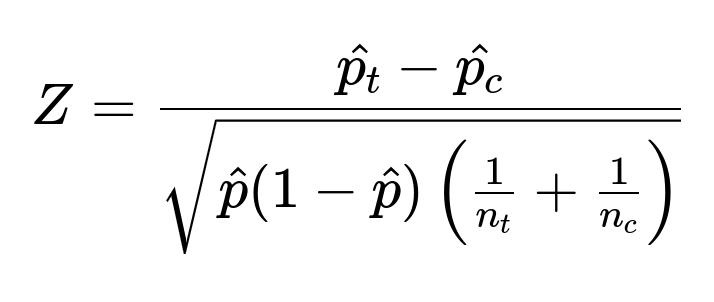
In this expression, hat{p_t} is the estimated proportion of unsubscribes in treatment, hat{p_c} is that in control, hat{p} is the pooled proportion across both groups, n_t is the sample size (number of users) in treatment, and n_c is the sample size in control.
Analyzing statistical significance is just one part of the story. Even if the difference in unsubscribe rates is pronounced, the next layer of insight involves looking at downstream engagement. This means assessing overall metrics such as session length, daily active users, click-through rates on notifications, frequency of app visits, and user retention over time. If unsubscribes are on the rise but engagement for the remaining subscribed users is increasing enough to offset or justify that loss, the change might still be acceptable. Conversely, if unsubscribes climb without substantial engagement gains, the new system could be harming the platform’s health.
It is also vital to segment users based on how they typically engage with Twitter. Users who are power users might welcome more notifications, while casual users could be easily annoyed. Tracking metrics like time spent on the platform, the volume of content consumed, or the user’s historical engagement patterns can highlight whether specific cohorts are driving most of the unsubscribes. By identifying those sub-populations, the product team can refine the notification strategy, perhaps introducing personalization so that only relevant notifications are delivered to each group.
Finally, it is important to explore whether other concurrent product changes are affecting user behavior. If the A/B test for the notification system is launched at the same time as a new user-interface rollout or a different feature that influences user behavior, it becomes harder to attribute unsubscribes solely to push notifications. Making sure that the experiment is properly isolated is key to drawing the correct conclusions about the new system’s impact on engagement.
How Can We Measure Long-Term Impact Versus Short-Term Metrics?
One crucial angle is whether the new system might cause immediate unsubscribes but potentially produce more long-term engagement benefits. Sometimes, a short period of increased unsubscribes may be followed by stabilized engagement among remaining users. Tracking churn over a longer period is often necessary to determine whether early negative signals are transient or indicative of deeper user dissatisfaction.
A practical approach is to continue monitoring both unsubscribes and engagement metrics over several weeks or months. Using survival analysis methods can be beneficial, as it helps model time-to-event data (in this case, time to unsubscribe) and reveals whether the hazard rate (risk of unsubscribing at any given time) changes in the treatment group compared to the control over the duration of the experiment.
How Should We Interpret Overall Business Metrics?
Even if unsubscribes increase, it might still be acceptable from a business perspective if the net effect on platform usage and revenue is positive. Engagement-based metrics, such as the average number of tweets read or posted, direct interactions with ads, and retention, should be examined in parallel. It may also be valuable to quantify user sentiment, perhaps through surveys or app store feedback, to see if the additional notifications generate frustration or if users see them as a helpful way to discover new content.
How Could We Validate Causality Versus Confounding Factors?
Although A/B testing aims to reduce confounding, other factors can creep in. For instance, if certain groups of users in the treatment are also introduced to a new feature that inadvertently boosts or reduces engagement, that confounder can distort the observed effect of notifications alone. Carefully controlled randomized assignment plus consistent product experiences for both groups helps, but it remains vital to watch for unintended differences (e.g., server issues or localized events) that might systematically affect one group.
One strategy is to analyze the randomization process itself to confirm that treatment and control groups are balanced in terms of historical engagement, device types, geographies, and other relevant attributes. If those checks reveal imbalance, post-stratification techniques or re-randomization may be needed.
How Could We Address Different User Segments That Exhibit Divergent Reactions?
Certain power users may appreciate more notifications, finding them valuable prompts to re-engage. Conversely, sporadic users could be overwhelmed and choose to unsubscribe or even churn from the platform. Segmenting the user base into cohorts—like new sign-ups, occasional users, power users, and dormant accounts—helps to see how each reacts. If the negative reaction is mostly confined to sporadic users, the product team may tweak the notification frequency, such as implementing a personalized system where a machine learning model determines the optimal volume of alerts.
Could Personalization Play a Role?
A potential follow-up step after identifying which subgroups are most negatively or positively impacted is to implement a personalized notification model. This model can incorporate user features, such as their typical usage hours, interests, language preferences, and previous interactions with notifications, to predict how many notifications should be sent and what topics might be of most interest. Evaluating the performance of such a system might further reduce unsubscribes, as users receive notifications tailored to their patterns instead of a one-size-fits-all approach.
# Example of a simple Python snippet for segment-based analysis

import pandas as pd

# Assume df has columns: 'user_id', 'treatment', 'unsubscribed', 'engagement_score', 'cohort'

# Group by treatment and cohort, then calculate average unsubscribes and engagement score
analysis = df.groupby(['treatment','cohort']).agg(
    avg_unsubscribe=('unsubscribed', 'mean'),
    avg_engagement=('engagement_score', 'mean'),
    count=('user_id','count')
).reset_index()

print(analysis)
This example groups data by treatment status and user cohort, computing the mean unsubscribe rate and average engagement score. The results highlight which groups are unsubscribing more and whether overall engagement is still healthy.
How Do We Ensure Statistical Robustness?
For a robust A/B test, the sample size must be adequate to detect a meaningful difference in unsubscribe rates or other key engagement metrics with high statistical power. Before launching the test, it is often helpful to conduct a power analysis to estimate how many users are needed in each group to reliably detect the anticipated effect size. In real-world scenarios where user experience is at stake, running the test for a predetermined duration to capture daily and weekly usage patterns is also recommended.
What If Unsubscribes Rise But Engagement Also Increases?
There could be a trade-off: losing some users who dislike frequent notifications while retaining or attracting others who appreciate more timely alerts. Whether this is acceptable depends on the net effect on the platform’s health. If the overall user base remains stable or grows, and key business metrics (like ad impressions or daily active users) go up, the increased unsubscribes might be tolerable. By contrast, if the change undermines user trust or leads to reputational damage, then it may not be worth pursuing, even if some metrics initially appear favorable.
How Could We Iterate or Roll Back?
If results reveal that too many notifications drive harmful outcomes, there should be a mechanism for quickly lowering the frequency or even reverting to the previous notification system. A rolling deployment strategy helps by gradually exposing users to the new system, letting the team detect issues early and revert if unsubscribes spike. Subsequent iterations can then incorporate more advanced approaches, like customizing frequency thresholds based on user behavior signals, or exploring different times of day to send notifications.
How Would We Formulate Recommendations?
After gathering and analyzing data on unsubscribes, engagement, usage frequency, and user satisfaction, the final step is to present informed recommendations. These could include reverting the change for certain user segments, limiting notification frequency, or improving personalization. The ideal solution often emerges from a delicate balance between immediate user sentiment and longer-term engagement objectives.
A data-driven recommendation might be to adopt a hybrid approach where most users receive the new notification strategy but certain identified cohorts receive fewer notifications. The results can be reevaluated in a subsequent experiment, continuously refining how notifications are delivered so that both user satisfaction and business metrics improve over time.
Could We Explore User Sentiment Qualitatively?
Quantitative analysis reveals what is happening, but it may not fully explain why. Conducting user interviews, focus groups, or surveys can unveil reasons behind unsubscribes, such as irrelevant content, too many notifications at inconvenient times, or dissatisfaction with the overall user experience. Insights gleaned from these qualitative methods often guide nuanced improvements that pure metrics-based methods may overlook. Combining both quantitative and qualitative approaches typically yields a more accurate assessment of the new system’s true impact on user engagement.
Below are additional follow-up questions
How Do We Incorporate Delayed Effects of Unsubscribes?
One subtle issue is that user dissatisfaction with frequent notifications might not manifest immediately. Some users may tolerate a larger volume of alerts for a while before eventually unsubscribing or reducing their engagement. A potential pitfall here is that if you only monitor unsubscribes in the first few days or weeks of an experiment, you might underestimate the true effect. Delayed or lagged effects can be captured by extending observation windows and using methods such as survival analysis to understand when unsubscribes or decreased usage are most likely to happen. Additionally, segmenting by user tenure may help: newer users might unsubscribe more quickly if they have no established habit, while long-time users might remain subscribed longer but eventually opt out if notifications become overwhelming.
In real-world settings, a common edge case is when a batch of external events or competing apps draws attention away from the platform around the same time a user’s notification volume goes up. Such factors can accelerate unsubscribes, so it’s important to separate the effect of increased notifications from external influences (e.g., a major competitor release) that also could cause users to disengage.
How Do We Handle Seasonality and External Events?
Seasonality can significantly influence engagement. For instance, social media usage often spikes or drops around holidays, weekends, or special public events. If you roll out the increased notification volume during a period of abnormal usage, you might falsely conclude that the notification change is responsible for differences in unsubscribe rates, while in reality, the effect might be partly due to seasonal user behavior. A best practice is to randomize treatment assignments across all relevant time blocks or ensure the experiment runs long enough to capture these seasonal patterns. Another subtle pitfall is conflating the effect of big news cycles with your notification experiment. For example, if a major sporting event or election is happening, user behavior may become more or less tolerant of notifications that relate to those happenings.
How Do We Account for a Threshold Effect in Notification Frequency?
In practice, many users will tolerate notifications up to a certain threshold. Once you exceed that threshold, the probability of unsubscribing or ignoring future notifications may skyrocket. A pitfall is failing to recognize that the relationship between number of notifications and unsubscribes is often non-linear. Simply averaging across all users or across a range of frequencies could hide the point at which unsubscribes begin to surge. One way to investigate this is to bin notification frequency into ranges and track the incremental unsubscribe rate for each bin. If you observe a sharp jump between, say, 5 notifications per day and 6 notifications per day, that signals a threshold-based user tolerance. The real-world complication: threshold levels can differ drastically by user type—some want frequent updates while others consider a single daily notification sufficient.
How Do We Measure Subtler Forms of User Dissatisfaction?
Not every unhappy user immediately clicks “unsubscribe.” Some may silently disengage—ignoring notifications or spending less time on the platform. If your measurement focuses solely on unsubscribes, you miss these subtler signs of dissatisfaction. Tracking downstream engagement metrics, such as time on platform, tweets read, or likes over time, can show a dip in interest preceding an eventual unsubscribe. Another sign could be how often users “dismiss” or “swipe away” notifications, if that data is logged. One edge case is that some users might turn off notifications at the device level (OS settings) instead of unsubscribing in-app, which can also mask the real decline in willingness to receive push alerts. A thorough measurement plan would account for both in-app unsubscribes and device-level opt-outs to capture the full picture.
How Could Multi-Armed Bandit Approaches Improve Notification Delivery?
Instead of a static A/B test, a multi-armed bandit strategy continually adjusts the distribution of notification frequencies based on real-time performance feedback. For instance, you might initialize multiple “arms” corresponding to different notification volumes or different content strategies, then progressively allocate more users to the more promising arms. The benefit is faster convergence on an optimal frequency with potentially lower risk of user annoyance. However, a pitfall is that bandit approaches can complicate interpretability. While you quickly find a good notification strategy, you might sacrifice the clean comparisons of a controlled A/B test. Also, bandits require careful definition of reward metrics (e.g., short-term engagement vs. long-term retention). If you optimize purely for immediate clicks, you risk causing high unsubscribe rates down the road.
What Are the Challenges of Random Effects and Repeated Measures?
When a user is exposed to multiple notifications per day over a span of weeks, this creates correlated data points that violate the independence assumptions of simple statistical tests. A pitfall is to ignore this repeated-measures structure and treat each notification event as an independent sample, which can lead to inflated false positives. To handle repeated measures, you can apply hierarchical models (e.g., mixed-effects models) that incorporate user-level random effects. This helps account for each user’s innate tendency to react or ignore notifications, providing more accurate estimates of how changes in notification frequency affect individuals. An edge case involves users who switch devices often or interact with the platform from multiple channels, making user-level correlation more complicated to track.
How Do We Evaluate the Impact on Alternative Channels?
Twitter might also send email digests or in-app pop-ups besides push notifications. When you increase push notifications, it may reduce the effectiveness of email alerts (if users are now seeing content sooner) or lead to unsubscribes from all channels. A pitfall is not monitoring other communication channels, which can hide the overall effect on user engagement. For example, if unsubscribes from email accelerate at the same time you add more push notifications, you might not realize the new policy is driving overall dissatisfaction. Conversely, some users may appreciate receiving new content across multiple channels. Thus, measuring cross-channel interactions is crucial. You could track, for each user, which channels are active and whether engagement in one channel cannibalizes or enhances the other.
How Do We Measure the Spillover Effect on New Users or Reactivations?
When you increase notification frequency, existing users might share more content or retweet, possibly attracting new sign-ups or reactivating dormant users. This is a spillover effect: the product change targeting one set of users might indirectly affect another group. A pitfall is focusing solely on unsubscribes of the immediate user base while ignoring the net positives that might occur if more notifications lead to increased content-sharing that recruits new users. However, measuring spillover in an A/B test can be tricky if new users are influenced by existing ones in the treatment group. You might need a cluster-based approach to randomization (e.g., randomizing at a network or region level) or at least track sign-ups that came via referrals from treatment vs. control users to capture indirect effects.
How Do We Ensure Fairness and Avoid Biased Outcomes?
Sending more notifications might disproportionately annoy certain user demographics, such as users on low-end devices that cannot handle large volumes of push alerts or those on data-limited plans. It’s important to verify whether any protected groups (e.g., by region, language, accessibility needs) are disproportionately affected in negative ways. A pitfall is ignoring these subgroups and inadvertently causing them to churn at higher rates. One strategy is to monitor unsubscribe and engagement metrics disaggregated by relevant demographic variables. If any fairness concerns arise (e.g., a certain region has extremely high unsubscribes), you can consider region-specific frequency caps or content targeting. This ensures the new system doesn’t unintentionally disadvantage certain users.
How Should We Configure Logging and Instrumentation for Notifications?
Push notifications are ephemeral. Once delivered, there might be limited visibility into how the user reacts unless they explicitly engage or unsubscribe. A common pitfall is incomplete event tracking: if the platform only logs whether a notification was clicked and not whether it was merely dismissed or triggered an unsubscribe, you might lack essential data. It’s crucial to instrument the system so each push delivery is logged in a server-side event, capturing user ID, notification type, timestamp, and any subsequent user action, such as clicks or unsubscribes. Doing this thoroughly ensures you have the granular data needed for advanced analyses, like building machine learning models to predict optimal notification timing.
What Happens if User Behavior Changes Mid-Experiment?
During a lengthy experiment, user preferences may shift over time for reasons unrelated to notifications (e.g., shifting social trends, competitor apps). This can confound results if the treatment or control group changes usage behavior differently over the experiment’s duration. A pitfall is to assume user behavior remains static. One way to spot changes is to track engagement trends for both groups across distinct time segments. If you see a consistent upward or downward drift unrelated to your notification strategy, you may need to either re-randomize or update your analysis to control for time effects. Another approach is sequential testing with checks at pre-specified intervals. If user sentiment or external conditions drastically change, you can pause and revisit the experimental design before continuing.
How Do We Reconcile Complex or Conflicting Outcomes?
Finally, it’s common to see multiple engagement metrics that appear to conflict. For instance, unsubscribes might rise, while daily usage also rises. Ad impressions may increase, but user satisfaction scores decrease according to surveys. A pitfall is trying to optimize all metrics simultaneously without defining which ones hold the most strategic importance. You need a well-defined hierarchy of metrics that clarifies which ones take priority. If unsubscribes are considered highly detrimental to the user experience, you might weigh them more heavily than improvements in ad impressions. Alternatively, if short-term revenue is paramount, the team could decide a small unsubscribe increase is an acceptable trade-off. Communicating these trade-offs clearly and aligning with broader company objectives is essential to making data-driven decisions that avoid confusion and internal disagreement.