
ML Interview Q Series: How can you figure out the right number of clusters to use when applying the K-Medoids technique?

📚 Browse the full ML Interview series here.
Comprehensive Explanation
When choosing the number of clusters in K-Medoids, we are essentially looking for a way to partition the data so that the total cost of assigning points to their nearest medoids is minimized without overfitting or underfitting. Unlike K-Means, which uses means as the cluster centers, K-Medoids selects actual data points as the central representatives (medoids). This often makes K-Medoids more robust to noise and outliers.
One way to formalize the objective function of K-Medoids is to consider the sum of distances from each data point to its assigned medoid:
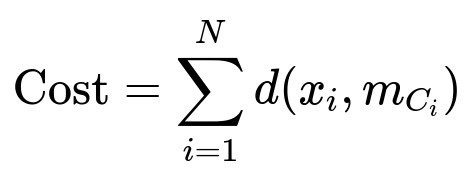
Here:
N is the total number of data points.
x_i is the i-th data point in the dataset.
m_{C_{i}} is the medoid representing cluster C_i (the cluster to which x_i is assigned).
d(.,.) is a chosen distance metric (like Manhattan distance or Euclidean distance, depending on the problem).
Determining the best value of K (the number of clusters) generally involves balancing model complexity with goodness of fit. Here are the typical strategies:
Elbow Method You can compute the K-Medoids cost for various K values and look for an “elbow” in the resulting cost curve. Initially, as you increase K, the total cost decreases significantly because you are allowing more clusters (hence each medoid serves fewer points). But after a certain point, the decrease in cost slows dramatically. This point of diminishing returns, or “elbow,” can be treated as the best K. However, identifying that elbow visually is sometimes subjective.
Silhouette Coefficient Another popular approach is the silhouette coefficient, which measures how similar each point is to the points within its own cluster compared to points in other clusters. For a single data point i, let a_i be the average distance to points within the same cluster, and b_i be the average distance to points in the closest different cluster. The silhouette score for point i is:
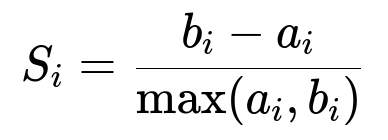
a_i is the average intra-cluster distance for point i.
b_i is the smallest average distance of point i to any other cluster that i is not a part of.
The silhouette coefficient ranges from -1 to 1, with higher values indicating more distinct and well-separated clustering. You typically compute the average silhouette coefficient across all points for each candidate K and pick the K that yields the highest average silhouette score.
Gap Statistic The gap statistic compares the observed data dispersion with that of reference uniform distributions. The reference distribution is generated under the null hypothesis that there is no natural clustering structure. You typically choose the K at which the gap statistic is largest. Although more computationally expensive, it is a robust method in many scenarios.
Cross-Validation and Likelihood-Based Methods For certain distance metrics or if you have a probabilistic interpretation of your clusters, you might attempt a form of cross-validation where you assess how well the model generalizes. However, pure K-Medoids doesn't typically come with a probabilistic density function, so this is less common.
Domain Knowledge In addition to these more algorithmic approaches, real-world constraints, such as how many types of groups are expected in the data from an application standpoint, often guide your choice of K. If your domain indicates only three meaningful classes of clients, it makes sense to start with K=3.
Practical Observations
K-Medoids tends to be more robust to noise and outliers, so sometimes the chosen number of clusters can be more stable compared to K-Means. Still, you might end up with slightly different cluster counts if you rely solely on heuristics like the elbow method or silhouette score.
Since K-Medoids can be more computationally expensive (especially with large data), it’s important to limit the range of K you test. For instance, you might only test K in [2..10] or [2..20], depending on the dataset size and domain constraints.
Preprocessing the data (e.g., removing extreme outliers or scaling/normalizing the data) still matters. Even though K-Medoids is robust to outliers, extremely unusual data points may still affect how your distance functions shape the clusters.
Follow-up Questions
Could you explain the difference between K-Means and K-Medoids in determining the optimal K?
K-Means uses centroids calculated as the mean of points in a cluster, which can be skewed by outliers. K-Medoids, on the other hand, chooses actual representative points (medoids). Because of that:
Outliers affect K-Means more significantly, often causing the centroid to move toward them. K-Medoids is more stable in the presence of outliers, so its cost curve may show a smoother or different pattern when varying K.
The optimal K for K-Means often relies on variance-based measures, whereas for K-Medoids, distance-based measures can be more intuitive (e.g., Manhattan distance can be used in scenarios where mean is not a good measure of central tendency).
How do you implement the silhouette coefficient for K-Medoids in Python?
You can compute the silhouette coefficient for K-Medoids by assigning each point to a medoid, then using standard formulas for a_i (intra-cluster distance) and b_i (nearest-cluster distance). Although scikit-learn’s metrics.silhouette_score is primarily tested with K-Means, you can use it with custom labels generated by a K-Medoids approach:
from sklearn_extra.cluster import KMedoids
from sklearn.metrics import silhouette_score
import numpy as np

# Sample data X in shape (n_samples, n_features)
X = np.array([...])  # your data

best_k = None
best_score = -1

for k in range(2, 10):
    kmedoids = KMedoids(n_clusters=k, method='pam', random_state=42)
    labels = kmedoids.fit_predict(X)
    score = silhouette_score(X, labels, metric='euclidean')
    if score > best_score:
        best_score = score
        best_k = k

print("Best K:", best_k, "with silhouette:", best_score)
This code loops over various values of K, fits a K-Medoids model, obtains the cluster labels, and computes the silhouette coefficient for each K. The best K is then selected by the largest average silhouette score.
Is the elbow method always reliable for K-Medoids?
The elbow method can provide a starting heuristic, but it’s not always definitive for two reasons:
The cost curve may not exhibit a clear elbow. You might see a steadily decreasing curve with no obvious point of inflection.
The decision can be subjective. What appears to be an “elbow” to one person might be ambiguous to another.
In practice, it helps to use the elbow method in combination with other metrics (like silhouette coefficient or gap statistic), along with domain knowledge about how many clusters are reasonable for the application.
Can you talk about the effect of distance metrics on choosing the number of clusters?
Since K-Medoids works with arbitrary distance metrics, your choice of distance function can significantly influence how clusters form. For example:
Euclidean distance is common for continuous data but can be sensitive to scaling and outliers.
Manhattan distance might be more suitable for data with many outliers, or for certain distributions that align with L1 norms.
Cosine distance might be used if your data are vectors in a high-dimensional space where only direction matters more than magnitude.
When you vary the distance metric, the total cost for each K and the silhouette or gap scores may change, so you might end up picking a different optimal K depending on the distance definition. It’s always a good practice to test multiple distance functions if you are unsure which suits your data best.
What if the dataset is very large and computing K-Medoids becomes expensive?
K-Medoids can be more computationally intensive than K-Means because it must evaluate the distances of all points to potential medoids, and it also must search among actual data points for possible replacements. For extremely large datasets:
Use approximate K-Medoids algorithms. There are variations or approximations like CLARA (Clustering Large Applications) which draw samples to reduce computation.
Parallelize distance computations if possible (e.g., with GPU or multi-core CPU).
Limit the search space of medoids. Instead of considering every data point as a potential medoid, you can pre-sample a subset of points.
In any of these approaches, you would still test for a range of K, but in a more restricted manner, and you might rely more heavily on domain knowledge to narrow down the search.
How do outliers affect K-Medoids' determination of K?
K-Medoids is often chosen because it is less sensitive to outliers than K-Means. An outlier in K-Means can pull the mean, potentially distorting the clusters. With K-Medoids, since a medoid must be one of the actual data points, the algorithm usually avoids picking an outlier as a medoid, which helps keep clusters more stable. However:
If there is a significant cluster of outliers, it might end up being its own small cluster. This can artificially inflate your chosen K if you rely purely on cost-based metrics without domain context.
Outliers can still inflate the overall cost. Silhouette or gap-based methods might then indicate adding another cluster, even if that cluster has very few points. Domain knowledge and data inspection are crucial to recognize when outliers are driving the choice of K.
Could you discuss any special considerations when data might contain categorical features?
K-Medoids can work well with various distance metrics, including those for categorical data (e.g., Gower distance). When data are purely categorical:
You need a distance measure that can handle categorical mismatch (like Hamming distance or Gower distance).
The silhouette method still applies, but you will compute a_i and b_i with the chosen distance. The same logic for selecting K remains, though you need to be mindful that categorical distances often have less granularity than continuous ones.
In some cases, the range of cluster sizes might differ if certain categories are rare. This might affect the elbow or silhouette curve.
These nuances reflect that the choice of distance metric and the data type can affect cluster structure and how you interpret performance metrics when deciding K.