
ML Interview Q Series: How do Support Vector Machines and Logistic Regression differ in their approach to outliers?


Comprehensive Explanation
Handling Outliers with Support Vector Machines
Support Vector Machines (SVM) focus on finding a maximum-margin hyperplane that best separates classes in the feature space. Outliers can exert a strong influence because they may require the hyperplane to shift in order to accommodate their classification within the margin constraints. SVM introduces a concept of soft-margin (through slack variables) to handle such scenarios. The penalty term in SVM controls the tolerance for misclassified or borderline points, including outliers.
A commonly stated optimization problem for a binary linear SVM includes regularizing the weight vector while penalizing training errors. This can be written in the primal form as a minimization of the norm of w plus some penalty for misclassifications. When an outlier appears, if we set the penalty parameter (often referred to as C) large, the model tries to reduce misclassification at the cost of a larger margin, which can lead to overfitting if there are many outliers. Conversely, if C is smaller, the model may allow some misclassifications and yield a broader margin, potentially reducing the influence of outliers but possibly increasing the training error.

Here,
w is the normal vector to the hyperplane.
b is the bias term.
\xi_i is a slack variable that allows point i to be within or beyond the margin.
C is the regularization parameter that balances margin size and misclassification penalty.
If an outlier is extremely far from the rest of the data but still influences the margin classification, a large C will make SVM attempt to classify it correctly (potentially harming generalization). A smaller C helps SVM ignore outliers but could also lead to higher training error.
Handling Outliers with Logistic Regression
Logistic Regression models the probability of class membership (often 0 or 1) by using a sigmoid function applied to a linear combination of features. Outliers in logistic regression can disproportionately affect the parameter estimates because the cost function is sensitive to points that are misclassified with high confidence. Specifically, the negative log-likelihood loss can become very large for outliers that are placed at regions where the sigmoid saturates.
One can incorporate regularization (like L2 regularization) to mitigate the impact of outliers. This shrinks the coefficient estimates and reduces their variance. However, logistic regression does not have an inherent mechanism like the slack variables in SVM; it simply tries to minimize the overall log-loss, which can assign large gradient updates to misclassified points.
Below is the typical cost function in logistic regression for a binary classification problem:
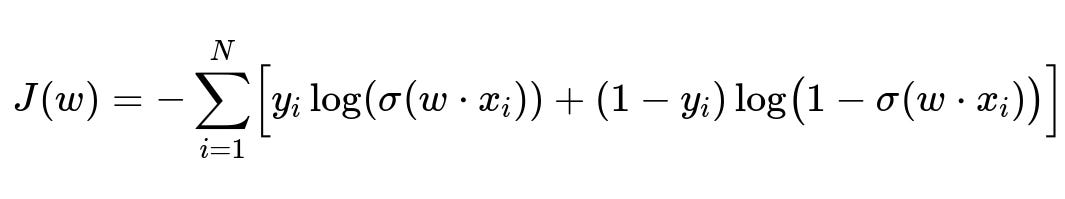
Here,
N is the number of training examples.
x_i is the i-th feature vector.
y_i is the i-th label in {0,1}.
w is the parameter vector.
\sigma is the sigmoid function 1/(1+exp(-z)).
When outliers occur, the corresponding terms in the sum can dominate the loss, forcing the optimizer to invest considerable effort adjusting the coefficients. This can lead to large coefficients if regularization is insufficient, potentially causing overfitting or instability. Properly chosen regularization and robust optimization methods can mitigate these effects.
Key Differences in Outlier Treatment
SVM has a margin-based mechanism, with the penalty factor C that provides a degree of control over how much misclassified or "borderline" data points, including outliers, can influence the margin. Logistic Regression relies on the gradient from the log-loss, which can be strongly influenced by badly misclassified points, especially in the tails of the sigmoid function. Consequently, outliers in logistic regression might warp the decision boundary more aggressively unless regularization is used. Meanwhile, SVM’s margin approach provides a more geometric interpretation of the impact of outliers, and an outlier's effect can be partially controlled by carefully tuning C.
Possible Implementation Snippets
# Example: Comparing SVM vs Logistic Regression quickly with synthetic data
import numpy as np
from sklearn.svm import SVC
from sklearn.linear_model import LogisticRegression
from sklearn.metrics import accuracy_score

# Simple synthetic data, with an outlier
X = np.array([[0, 0], [1, 1], [2, 2], [10, 10]])  # note the outlier (10, 10)
y = np.array([0, 0, 1, 1])

# SVM with two different penalty settings
svm_strong_penalty = SVC(C=100).fit(X, y)
svm_weak_penalty = SVC(C=0.01).fit(X, y)

# Logistic Regression with default regularization
log_reg = LogisticRegression().fit(X, y)

# Predictions
svm_pred_strong = svm_strong_penalty.predict(X)
svm_pred_weak = svm_weak_penalty.predict(X)
logreg_pred = log_reg.predict(X)

print("SVM (large C) Accuracy:", accuracy_score(y, svm_pred_strong))
print("SVM (small C) Accuracy:", accuracy_score(y, svm_pred_weak))
print("Logistic Regression Accuracy:", accuracy_score(y, logreg_pred))
This code contrasts the effect of changing the penalty parameter in SVM. A large C enforces fewer misclassifications of outliers, potentially influencing the margin significantly. A smaller C might allow misclassifying the outlier but can improve generalization.
Follow-Up Questions
How can one detect if an outlier is overly influencing SVM or Logistic Regression?
You can investigate model coefficients and decision boundaries. For SVM, an unusually high value of the norm of w, or support vectors that seem extremely distant, can be a red flag. For Logistic Regression, very large coefficient magnitudes and unstable optimization behavior (especially if you see the parameters oscillate during gradient descent) might imply that a few outliers are pushing the model. Techniques such as Cook’s distance (though traditionally used for linear regression), or analyzing changes in the decision boundary when removing potential outliers, can also help identify influential points.
Would scaling or normalization of features help mitigate the influence of outliers?
Yes, scaling or normalization typically helps both SVM and Logistic Regression. In SVM, unscaled features can lead to suboptimal margins, especially if some features have very large ranges. In logistic regression, extremely large feature values can exacerbate gradient issues and cause very large parameter estimates. Proper normalization (e.g., standardization or min-max scaling) can often reduce the undue effect of outliers, though it does not fully eliminate the need for robust model design choices (like regularization and parameter tuning).
How does class imbalance interact with outliers in SVM and Logistic Regression?
Class imbalance can compound the issue of outliers. If most outliers reside in the minority class, both SVM and Logistic Regression might try hard to fit those points, especially if the penalty parameter is high or if the logistic loss is dominated by the outliers. Remedies include:
Adjusting class weights: In SVM, you can set class_weight to "balanced" or a custom ratio. For logistic regression, similarly, you can use class_weight in libraries like scikit-learn.
Using appropriate sampling strategies: Oversampling the minority class (e.g., SMOTE), or undersampling the majority class, helps reduce overemphasis on outliers.
Hyperparameter tuning: For SVM, carefully choose C while considering the imbalance. For logistic regression, tune the regularization strength, typically inverse of regularization parameter (C in scikit-learn).
When might I prefer SVM over Logistic Regression if outliers are present?
You might prefer SVM if you can carefully adjust the penalty parameter and benefit from its margin-based approach. If the data is mostly separable and outliers represent only a small fraction of unusual points, the margin-based optimization of SVM—potentially with a kernel—can lead to a robust separation of classes. However, if outliers are not rare or if you need probabilistic outputs (e.g., for well-calibrated probabilities), logistic regression might be preferred, combined with strong regularization to limit outlier influence.
Below are additional follow-up questions
How do kernel-based SVMs handle outliers differently compared to linear SVMs?
Kernel-based SVMs project the data into a high-dimensional feature space using a kernel function (such as RBF, polynomial, or sigmoid), then attempt to find a separating hyperplane in that transformed space. Outliers may still be influential if the penalty parameter C is large, because the model may try to classify them correctly at all costs. However, in certain kernel spaces, outliers might become less influential if they are “isolated” after the transformation, effectively minimizing their impact on the overall margin.
A potential pitfall is that certain kernels, especially highly flexible ones like the RBF kernel, can overfit if C is large and the kernel hyperparameters (e.g., gamma in the RBF kernel) are set too aggressively. This can amplify the effect of outliers, because the model can create extremely localized decision boundaries that accommodate these unusual points. Consequently, careful hyperparameter tuning for both C and the kernel-specific parameters is crucial. Overlooking this can lead to models that appear to perform well on training data but fail to generalize.
Are there robust variations of Logistic Regression that handle outliers more effectively?
Yes, there are approaches referred to as robust logistic regression, which modify the traditional log-likelihood loss to down-weight points that deviate significantly from the majority. Some techniques employ robust loss functions (e.g., Huber loss adaptations or other M-estimators) that temper the influence of extreme misclassified observations. The idea is similar to robust linear regression, which uses alternatives to the least-squares criterion.
A subtlety here is that robust methods can be more difficult to optimize because the loss functions might not be as straightforward or smooth as the standard log-likelihood. Convergence might require specialized algorithms or more iterations. Another consideration is the trade-off between ignoring genuine outliers (which should be handled robustly) and ignoring important minority patterns (which might resemble outliers but represent a meaningful portion of the data). Tuning hyperparameters for robust logistic regression often requires cross-validation with a careful balance between ignoring spurious outliers and preserving crucial minority cases.
If outliers are mislabeled data, should we remove them, and how does that impact SVM and Logistic Regression differently?
In practice, mislabeled data can appear as outliers because the features and labels do not match typical patterns. If these points are indeed labeling errors rather than genuine rare cases, removing or correcting them often improves model performance.
For SVM, mislabeled data can drastically shift the margin or force the introduction of large slack variables. If the penalty parameter C is high, the model tries to classify these erroneous points correctly, potentially distorting the decision boundary. For logistic regression, mislabeled points can produce unusually large gradient updates, again skewing parameter estimates.
A significant pitfall is hastily discarding all seemingly outlier points. Some genuine, though rare, data points might be mislabeled in the data set, but others might reflect real edge cases. Confirming mislabeling often requires domain knowledge or additional data collection. Blindly removing them might sacrifice valuable information about rare but important scenarios.
How do we handle outliers in a streaming or online learning setting for SVM and Logistic Regression?
In streaming or online learning, data arrives continuously, and the model updates itself incrementally without retraining from scratch. With SVM, online variants (such as incremental or budgeted SVM) maintain a set of support vectors that adapt as new examples come in. Outliers in the incoming data may temporarily dominate updates if they significantly violate the current margin. Over time, the model might discard or de-emphasize them if they remain unrepresentative of subsequent data.
For logistic regression, stochastic gradient descent (SGD) is commonly used for online learning. Each outlier can create a disproportionately large gradient step, potentially pushing parameters toward extreme values. Implementing learning rate schedules, gradient clipping, or employing robust loss functions can help mitigate the effect. A pitfall arises if the data stream contains bursts of outliers that occur in short intervals: the model might be destabilized, especially with high learning rates. Monitoring performance on a small hold-out (or a moving window) can detect when outliers are harming the model.
How do correlated features exacerbate the impact of outliers for each method?
Correlated features often amplify how outliers shift decision boundaries. In SVM, correlated features can confuse the maximum margin search if the outlier resides in a direction spanned by multiple overlapping features. The slack variables and margin constraints might have trouble disentangling the redundancy. This may lead to more support vectors near the outlier region or an overemphasis on incorrectly scaled dimensions.
In logistic regression, correlated features often manifest as unstable or inflated coefficients, particularly if one or more outliers exist in that correlated feature subspace. The optimization may attempt to assign large weights to certain features to accommodate the odd data point. This can cause high variance in the parameter estimates, leading to overfitting or convergence issues.
A key pitfall is ignoring feature engineering and assuming that standard regularization will always fix the issue. While regularization (especially L2) can help dampen large coefficients, it might not completely resolve the distortions introduced by outliers in correlated features. Employing dimensionality reduction or domain-based feature selection can alleviate the problem.
Is it possible to measure how outliers affect the reliability of the decision boundary for SVM or Logistic Regression?
Yes. Several uncertainty or stability analyses exist to gauge how outliers might affect a decision boundary. Techniques include:
Sensitivity analysis: Systematically remove (or re-weight) suspected outliers and observe changes in decision regions.
Cross-validation with outlier-aware folds: Intentionally place potential outliers in specific folds to see if performance is drastically different in those folds.
Examination of margins and support vectors in SVM: If a small set of points (potentially outliers) lie on the margin or inside it, it suggests heavy reliance on them. Similarly, examining logistic regression’s coefficients’ confidence intervals or standard errors can reveal instability.
Pitfalls arise if one relies solely on accuracy or a single performance metric without investigating how boundaries shift under small data perturbations. Some outliers might not drastically change accuracy yet have substantial impact on generalization (e.g., if the outliers are out of distribution). Qualitative inspection of decision boundaries can be as important as quantitative measures.
What metrics are most suitable for assessing the effect of outliers in these models?
Metrics that go beyond simple accuracy often reveal the influence of outliers more effectively. Examples include:
Hinge loss (for SVM) or log-loss (for logistic regression) distributions: Observing whether a few data points dominate these loss values.
AUC (Area Under the ROC Curve), Precision-Recall AUC: Outliers in one class may inflate or deflate these metrics in misleading ways, so analyzing them alongside confusion matrices can indicate if outliers cause extremes in prediction.
Calibration curves (particularly for logistic regression): If outliers are shifting the predicted probabilities, a calibration plot may show poor alignment with true frequencies.
A potential pitfall is relying on aggregate metrics without investigating the tails of the distribution. For instance, outliers in a minority class might not alter an overall accuracy metric much but can distort predicted probabilities or produce very high false positive/negative rates. Therefore, one should always inspect multiple facets, including threshold-based metrics and distribution of predicted probabilities.
How can dimensionality reduction be used to help both SVM and Logistic Regression deal with outliers?
Dimensionality reduction (PCA or more robust methods like ICA or autoencoders) can compress features into a lower-dimensional representation. This can help because outliers might become isolated or more apparent in a reduced space, allowing you to detect or handle them before classification. In PCA, for instance, an outlier might present as a point with high variance in one principal component. In more robust methods like robust PCA, large outliers often form a sparse matrix separate from the low-rank representation of normal data.
A hidden pitfall is that linear dimensionality reduction such as standard PCA can itself be heavily influenced by outliers, potentially distorting principal components to align with anomalous points. To truly mitigate outliers’ effects, robust dimensionality reduction methods that specifically handle large deviations are advisable. Once a more reliable, reduced feature set is obtained, SVM and logistic regression can be trained on a cleaner representation.
Could advanced data-cleaning strategies be used prior to training? Would that differ for SVM vs Logistic Regression?
Yes, advanced data-cleaning strategies such as outlier detection and removal, robust imputation, or domain-driven anomaly checks often precede model training. Methods like Isolation Forest, DBSCAN, or statistical tests (e.g., using interquartile range) can highlight suspicious points, which can then be removed or handled separately.
For SVM, removing outliers can reduce the number of extreme support vectors that might distort the margin. For logistic regression, removing or down-weighting these points can prevent large parameter updates. However, removing data points reduces the overall dataset, risking the loss of truly informative samples. A big pitfall is that an automatic detection algorithm might classify legitimate boundary cases as outliers. Over-filtering or incorrectly filtering data can compromise the model’s ability to generalize in edge scenarios.
What special considerations arise if outliers appear only at inference or test time?
When outliers appear in the test set but were absent (or less frequent) in the training data, the model may produce unreliable predictions. For SVM, the new outlier could lie far from any support vector region, leading to an extrapolation beyond the margin. For logistic regression, encountering unseen feature patterns can force predictions with high or low probabilities that are not well-calibrated.
One subtlety is that if you detect such an outlier dynamically, you might choose a fallback policy (e.g., rejecting the sample, triggering a manual review, or using a more flexible model). Another strategy is online updating of the model, but that raises questions about concept drift and whether this new outlier is the start of a new distribution shift. The risk is that adjusting the model after seeing just a few outliers could degrade performance on the bulk of “normal” data. If outlier detection was not part of the original pipeline, these real-world occurrences can lead to surprising failure modes that you had not accounted for in development.