
ML Interview Q Series: How do we determine whether a dataset exhibits enough separability for clustering methods to provide meaningful segments?


📚 Browse the full ML Interview series here.
Comprehensive Explanation
Clustering involves grouping data based on similarity measures, aiming to isolate cohesive clusters internally while maximizing separation between them. When data is not separable enough, clustering algorithms tend to produce ambiguous or unstable groupings. Below are crucial aspects and methodologies to assess the inherent structure of a dataset and whether clustering is likely to yield meaningful results.
Intuition Behind Cluster Separability
Meaningful clustering hinges on the idea that each group of observations is more similar within itself than to other groups. If data points overlap extensively or form a continuum, then no clear partition can be drawn, resulting in poor clustering performance. By contrast, when observations naturally group themselves, algorithms that rely on distance-based or density-based metrics can identify these tight clusters with minimal overlap.
Exploratory Visualization and Preprocessing
Plots such as scatter plots for 2D or 3D data, projection methods like PCA for high-dimensional data, or t-SNE for more complex manifolds can provide initial insights. If you see pronounced groupings or well-separated blobs in reduced-dimensionality plots, it may suggest that clustering is feasible. However, dimensionality reduction can sometimes be misleading due to distortion of distances, so it’s helpful to combine visual inspection with quantitative validation measures.
Silhouette Coefficient
A widely used metric to evaluate how well-clustered the data is involves looking at the silhouette coefficient. It measures how similar a point is to points in its own cluster compared to points in other clusters. The silhouette value for a single data point i is:
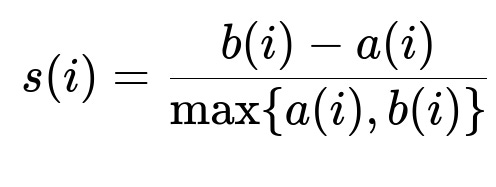
Here, a(i) is the average intra-cluster distance for point i, meaning the average distance to all other points in the same cluster. b(i) is the minimum average distance from point i to any other cluster. The overall silhouette coefficient is often taken as the mean of s(i) over all data points. Values near 1 imply strong separation, values near 0 suggest overlapping clusters, and negative values indicate potential misclassification. A higher silhouette score in the range of 0.5 to 1.0 often indicates that the data is reasonably separable for the number of clusters chosen.
Other Validation Indices
Alternative measures include the Davies-Bouldin index, which evaluates average cluster similarity relative to inter-cluster separation, and the Calinski-Harabasz index (variance ratio criterion). These indices quantify how well-defined the clusters are. Larger or smaller values (depending on the index’s convention) usually indicate better separability.
Elbow Method and Gap Statistic
Some practitioners use the elbow method, plotting within-cluster sum of squares against the number of clusters. A sharp bend (or “elbow”) in the plot can indicate an optimal cluster count if one exists. The gap statistic compares the within-cluster dispersion with that expected under an appropriate reference null distribution, identifying whether the dataset exhibits significantly more clustering tendency than random data with uniform spread.
Practical Implementation and Domain Knowledge
Assessing cluster tendency is seldom based solely on a single metric. Domain knowledge greatly influences whether the discovered clusters make sense. Even if quantitative scores suggest separability, the clusters must be interpreted and validated in a real-world context. Preprocessing steps such as feature scaling or principal component analysis can also influence clustering outcomes and separation measures.
Example Code Demonstration Using Silhouette in Python
import numpy as np
from sklearn.cluster import KMeans
from sklearn.metrics import silhouette_score
from sklearn.datasets import make_blobs

# Generate synthetic data
X, _ = make_blobs(n_samples=500, centers=3, random_state=42)

# Let's try clustering for k = 3
kmeans = KMeans(n_clusters=3, random_state=42)
labels = kmeans.fit_predict(X)

# Compute the silhouette coefficient
sil_score = silhouette_score(X, labels)
print("Silhouette Coefficient:", sil_score)
This code illustrates a basic approach to check how well the data is clustered by computing the silhouette score. If the score is high (close to 1), it typically reflects well-separated clusters.
How Distance Metrics Affect Clustering
Different algorithms and distance metrics can drastically influence cluster formations. If data is not naturally Euclidean, using specialized metrics or kernel transformations might reveal better structure. In high-dimensional spaces, distance measures can become less meaningful due to the curse of dimensionality, so sometimes dimensionality reduction or specialized distance metrics tailored to the domain can help.
Next Follow-Up Question
What if the silhouette score is low, but we suspect the data might still form meaningful clusters under a different perspective?
You can try alternative distance metrics, clustering algorithms, or data transformations. For instance, density-based clustering methods like DBSCAN can discover arbitrarily shaped clusters and outliers more effectively than centroid-based methods if your data’s geometry is not spherical. You might also apply various kernels or non-linear transformations to project data into a space where clusters are more naturally separable.
Next Follow-Up Question
How does one decide when to trust a metric like the silhouette coefficient versus relying on domain expertise?
It is important to balance statistical or geometric measures with domain insights. A high silhouette coefficient indicates well-separated data in the chosen feature space, but it does not always translate to clusters that make sense for a specific real-world application. Conversely, even if the silhouette coefficient is moderate, domain knowledge might indicate that the clusters are meaningful. Thus, combining internal validation measures (like silhouette or Davies-Bouldin) with external validation (labels or domain-driven grouping) is generally advisable.
Next Follow-Up Question
Are there potential pitfalls of using these measures in high-dimensional data?
In high-dimensional data, distance metrics can become less discriminative because points tend to appear equidistant from each other. Silhouette scores might become less reliable, and techniques like PCA or t-SNE might not necessarily preserve the true structure. In such settings, alternative methods like specialized dimensionality reduction, manifold learning, or domain-specific feature construction become critical. Additionally, computational complexity grows with dimensionality, which can also obscure your cluster validation measures.
Next Follow-Up Question
When should one conclude that clustering is not the right approach?
If you have thoroughly tested multiple clustering algorithms, varied the hyperparameters, examined multiple validation indices, and introduced domain knowledge, yet none of these approaches reveal stable, interpretable groupings, it may indicate the absence of meaningful clusters. In such cases, consider alternative approaches such as classification (if labels are available), regression (if the goal is to predict a continuous outcome), or more flexible algorithms like mixture models or topic modeling if the data structure suggests an alternative representation.