


📚 Browse the full ML Interview series here.
Comprehensive Explanation
The F-test is commonly used in statistical models (particularly in ANOVA and linear regression) to compare how much variance in the target variable can be explained by a subset of features relative to the variance that remains unexplained. In feature selection, especially univariate feature selection, we often perform an F-test on each feature (or groups of features) to measure its (their) relationship with the target. This helps rank features by their predictive power under certain assumptions of linearity and normality.
When using a simple linear model, the F-statistic can be expressed in terms of the regression sum of squares (SSR) and the error sum of squares (SSE). Suppose we have k features (excluding the intercept) and n samples. Then:

Where SSR represents the portion of total variance explained by the model, and SSE is the variance that remains unexplained. The number of features is k, and n is the total number of observations. This statistic follows an F-distribution under the null hypothesis that all the relevant regression coefficients (for these k features) are zero (i.e., the features have no explanatory power beyond random chance). A higher F-statistic typically indicates that the variance explained by the features is significantly higher than what might be expected by chance.
In the context of feature selection, one straightforward approach uses univariate tests:
For regression tasks, the test often used is
f_regression, which calculates an F-statistic between each feature and the continuous target.For classification tasks, the test is often
f_classif, which calculates an ANOVA F-statistic between each feature and the discrete target.
Features can then be ranked by their F-values, and those with the highest values (lowest p-values) are selected. Libraries such as scikit-learn provide convenient modules like SelectKBest and SelectPercentile that automate this process.
Below is a Python example illustrating how to select features with an F-test for a regression problem:
from sklearn.datasets import make_regression
from sklearn.feature_selection import f_regression, SelectKBest
from sklearn.linear_model import LinearRegression
from sklearn.model_selection import train_test_split
import numpy as np

# Generate synthetic data
X, y = make_regression(n_samples=1000, n_features=10, noise=10, random_state=42)

# Apply univariate F-test for feature selection
selector = SelectKBest(score_func=f_regression, k=5)
X_selected = selector.fit_transform(X, y)

# Check which features were selected
selected_features = selector.get_support(indices=True)
print("Selected feature indices:", selected_features)

# Train a model on the selected features
X_train, X_test, y_train, y_test = train_test_split(X_selected, y, test_size=0.2, random_state=42)
model = LinearRegression()
model.fit(X_train, y_train)
print("Train score:", model.score(X_train, y_train))
print("Test score:", model.score(X_test, y_test))
This example performs a univariate F-test (f_regression) between each feature and the target. It then selects the top k features (k=5 here). This process can be similarly applied to classification tasks by using f_classif.
Using the F-test assumes that each individual feature has a predominantly linear relationship with the target and that the data (for each feature) are normally distributed within classes (for classification) or are normally distributed in terms of error (for regression). It also does not capture interactions among features. Hence, while the F-test can help identify powerful individual features, you might miss complex relationships that emerge when multiple features interact.
What are the assumptions of the F-test in feature selection?
The F-test relies on the assumption that the residuals are normally distributed, that the variance of residuals is constant across different levels of the features, and that the effect of each feature is additive and linear. If these assumptions are violated, the F-statistic may not follow its theoretical distribution, and p-values might be misleading. Transformations of the data or non-parametric feature selection methods may be needed if assumptions are severely violated.
How can correlated features affect F-test-based selection?
When features are highly correlated, the F-test evaluates each feature individually without considering redundancy or multicollinearity. In such cases, two correlated features might both get high F-scores, yet selecting both may not add real explanatory value to the model. Techniques like recursive feature elimination, or regularization-based methods (LASSO, Ridge) that account for correlation in a more holistic way, can be combined with or used instead of straightforward F-test approaches.
Can F-tests be used for both classification and regression?
F-tests can be used in both contexts, but the specific test changes:
For regression with a continuous target,
f_regressionis used. This computes a linear regression F-statistic for each feature with respect to the continuous target.For classification with a categorical target,
f_classifis used. This is based on ANOVA between each feature and the class labels.
How to handle interactions among features when using the F-test?
The univariate F-test approach evaluates each feature’s effect in isolation. If there are strong interactions, a single feature might show a weak marginal effect but contribute strongly when combined with another feature. Standard univariate F-tests cannot detect such interactions. Approaches like polynomial feature expansions, two-way or multi-way ANOVA, or model-based methods that incorporate interactions can be used to capture these more complex relationships.
What if the data is not normally distributed or exhibits non-linearities?
If the data violate normality or linearity assumptions, transformations (e.g., log, Box-Cox) can sometimes help. Alternatively, other methods, such as mutual information-based selection or tree-based methods, may be more robust to non-linearity and non-normality. The decision depends on how severely the assumptions are violated and on domain-specific considerations.
How do we prevent overfitting when selecting many features with an F-test?
When many features are tested simultaneously, the probability of finding at least one “significant” feature by chance increases (multiple comparisons problem). Correction methods (like Bonferroni correction or false discovery rate control) can mitigate this. Another practical approach is to partition data into training and validation sets, perform feature selection on the training set alone, and then verify on a separate validation set. This helps to confirm that the selected features truly generalize.
How would you practically use F-test feature selection in a pipeline?
You might build a machine learning pipeline in scikit-learn that includes a feature selection step followed by a model, ensuring that feature selection happens inside cross-validation. This way, the selected features are based only on the training folds at each step, minimizing data leakage and giving a more reliable estimate of real-world performance. For example:
from sklearn.feature_selection import SelectKBest, f_regression
from sklearn.linear_model import LinearRegression
from sklearn.model_selection import cross_val_score, KFold
from sklearn.pipeline import Pipeline

pipeline = Pipeline([
    ('select_features', SelectKBest(f_regression, k=5)),
    ('lr_model', LinearRegression())
])

cv = KFold(n_splits=5, shuffle=True, random_state=42)
scores = cross_val_score(pipeline, X, y, cv=cv, scoring='r2')
print("CV Scores:", scores)
print("Mean CV Score:", scores.mean())
This ensures that each fold in the cross-validation process identifies its own best features and builds a model on those features alone, yielding a less biased performance measure.
Below are additional follow-up questions
How do you interpret the F-test when multiple features are selected simultaneously?
In many scenarios, univariate F-tests are conducted separately on each feature to determine its individual relationship with the target. However, real-world datasets often contain multiple features that jointly influence the outcome. Interpreting a univariate F-test in the presence of multiple features can be misleading because:
The test does not capture how features may overlap in the variance they explain in the target.
Some features may appear significant individually but lose significance when considered jointly (due to shared variance or interactions).
Other features might look weak on their own but become strong in the presence of another interacting feature.
A partial F-test approach can be used in linear regression contexts to compare a “full” model (with more features) against a “restricted” model (with fewer features). This provides insight into whether adding a specific subset of features leads to a statistically significant improvement in the model’s explanatory power. However, partial F-tests typically assume linearity, homoscedasticity, and normally distributed errors. If these assumptions do not hold, the p-values derived may be unreliable.
Pitfalls and Edge Cases:
If you select features purely based on univariate F-tests and ignore potential interaction effects, you might discard features that are critical in combination with others.
In high-dimensional settings, many F-tests are performed simultaneously, elevating the risk of false discoveries, so corrections (like Bonferroni or FDR) may be necessary.
When features are correlated, the univariate F-test does not properly adjust for that correlation. This can overstate the importance of some features and understate the importance of others.
How do outliers affect F-tests in feature selection?
The F-test for feature selection in a regression setting often relies on assumptions of normally distributed errors and homoscedasticity (constant variance). Outliers can seriously violate these assumptions, causing:
Inflated estimates of variance, potentially reducing the F-statistic and making truly predictive features appear insignificant.
Distortion in the mean response, leading to spurious significance for certain features that merely happen to align with outlier points.
Possible Mitigations:
Use robust scaling or transformation (e.g., log-transform) to reduce the effect of outliers.
Investigate and remove or cap outliers if they are data errors or extreme artifacts; if they are valid but extreme points, consider using robust regression methods or non-parametric feature selection strategies.
If outliers are genuine, interpret F-test results cautiously and possibly combine them with robust methods such as median-based tests or robust regression diagnostics.
Pitfalls and Edge Cases:
Aggressive outlier removal might discard crucial rare instances that contain important signal (e.g., fraud detection).
Merely applying a standard F-test without exploring outlier behavior can lead to incorrectly ranking features.
What is the difference between parametric (e.g., F-test) and non-parametric methods for feature selection?
Parametric methods like the F-test assume a particular distribution and linear relationships. Non-parametric methods do not rely heavily on these assumptions. Examples of non-parametric approaches include:
Mutual information, which captures more general dependencies between a feature and the target (beyond linear correlation).
Tree-based importance measures, which can handle non-linearities and categorical variables without explicit transformations.
Trade-Offs:
Parametric methods (F-test) are computationally efficient and straightforward to interpret if assumptions are met.
Non-parametric methods are typically more flexible and robust to anomalies such as outliers or non-linear relationships but can be computationally heavier. Their interpretations can also be more nuanced (e.g., partial dependence plots for tree-based models).
Pitfalls and Edge Cases:
If your data truly follows the assumptions of a linear model, non-parametric methods might overcomplicate feature selection and become susceptible to overfitting with smaller datasets.
If assumptions are violated (e.g., strong non-linearities, skewed distributions), relying solely on the F-test can lead to suboptimal or incorrect feature selection.
Why might you prefer a model-based feature selection approach over F-tests for large-dimensional data?
For high-dimensional data (such as thousands of features), univariate F-tests must be computed for each feature, and each test could inflate the risk of false positives. Additionally, feature interdependencies are not accounted for. Model-based methods like LASSO or tree-based feature importances:
Evaluate sets of features jointly, automatically penalizing or shrinking coefficients of less relevant features (LASSO) or capturing splits that have the greatest gain in reducing impurity (tree-based methods).
Can handle interactions or non-linear relationships better (especially tree-based approaches).
Potentially reduce false positives by considering regularization or data-driven splitting criteria.
Pitfalls and Edge Cases:
Model-based approaches can be more computationally expensive than simple univariate F-tests, particularly for very large datasets.
Tuning parameters (e.g., regularization strength, tree depth) adds complexity. Improper tuning can lead to either underfitting or overfitting.
In which scenarios does the F-test fail or produce misleading results for classification tasks?
In classification, f_classif performs an ANOVA F-test across class means for each feature. This can fail when:
The number of samples per class is highly imbalanced, skewing the sample means and variances.
Class distributions are not normally distributed; the ANOVA F-test presumes normal distributions within each class group.
Non-linear or complex relationships exist, and looking at mean differences alone underestimates the importance of certain features.
Pitfalls and Edge Cases:
If classes have very different variances, the F-test can misinterpret noise as signal or vice versa.
With heavily imbalanced classes, the test might detect “differences” primarily due to the smaller class sizes having inflated variance estimates or the larger class dominating the distribution.
Multi-class settings where classes overlap in non-trivial ways might produce borderline or inconclusive results.
Is it necessary to scale or standardize features before applying the F-test?
Because the F-test in a regression or ANOVA context examines explained vs. unexplained variance, scaling does not necessarily affect the rank of univariate F-statistics in a fundamental way—each feature’s variance is evaluated relative to the variance within the target. However, standardizing might still help in certain circumstances:
If a feature’s raw scale is extremely large or extremely small, numerical stability issues can arise in the computation. Scaling can reduce potential floating-point errors.
When combining different methods (e.g., pipelines that involve F-test selection and regularized linear models), consistent scaling across all steps can be beneficial.
Pitfalls and Edge Cases:
Over-scaling or inconsistent application of scaling can alter how the model sees the data. Always fit the scaler on the training portion only to avoid data leakage.
If the F-test is applied purely as a univariate filter and the numerical computations are stable, scaling might not significantly change the resulting p-values.
What are partial F-tests in linear models, and how do they apply to feature selection?
A partial F-test compares a “full model” containing a set of features to a “restricted model” with a subset of those features removed. The test statistic is computed by examining how much the error (SSE) increases when moving from the full model to the restricted model, relative to the increase in degrees of freedom:
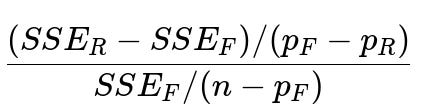
Where:
SSE_R is the sum of squared errors in the restricted model.
SSE_F is the sum of squared errors in the full model.
p_R is the number of parameters in the restricted model (including the intercept).
p_F is the number of parameters in the full model (including the intercept).
n is the total number of observations.
This statistic follows an F-distribution under the null hypothesis that the additional parameters in the full model are all zero. A significant result suggests that the features excluded from the restricted model provide explanatory power beyond what’s already in the restricted model.
Application to Feature Selection:
You can systematically add or remove features (one or more at a time) and perform partial F-tests to see if the change is statistically significant.
This is particularly useful in stepwise approaches, although stepwise procedures (both forward and backward) have their own pitfalls like multiple comparison issues and local minima in selection.
Pitfalls and Edge Cases:
Repeatedly applying partial F-tests (e.g., in a stepwise manner) inflates the risk of type I errors if not properly adjusted.
If the data do not satisfy linearity or normality assumptions, the partial F-test p-values can be unreliable.
Computational overhead can become large for big feature sets if partial F-tests are done exhaustively (testing all subsets). This is rarely feasible in very high-dimensional data.