
ML Interview Q Series: How would you handle a binary classification task with a 99%-1% significant class imbalance?

📚 Browse the full ML Interview series here.
Short Compact solution
It is important to begin by checking whether additional data can be acquired, since more samples of the minority class can help balance the distribution. If that is not feasible, you should choose performance measures that reflect success on the minority class (for example, F1 score, precision, recall, or the ROC curve) rather than relying on accuracy alone. You can modify the dataset by oversampling the minority class or undersampling the majority class, potentially using techniques like bootstrapping. More sophisticated approaches include generating synthetic samples using methods such as SMOTE. Another strategy is to use ensemble methods that adjust the ratio of the rare to abundant class, or to tweak the decision threshold rather than defaulting to 0.5. You might also experiment with cost-sensitive training by assigning heavier penalties to misclassifications of the rare class, thereby forcing the model to pay more attention to those examples.
Comprehensive Explanation
Imbalanced datasets can be challenging because a standard training procedure might bias the model toward predicting the majority class, leading to misleadingly high accuracy but poor performance on the minority class. To effectively address this issue, you must consider multiple dimensions:
Choosing Proper Metrics
Accuracy often fails to capture how well the model performs on the minority class. Metrics such as precision, recall, F1 score, and the Area Under the ROC or PR Curve are more informative in highly skewed scenarios. Recall becomes especially critical if it is very costly to miss the minority class (for instance, in fraud detection or medical diagnosis).
F1 Score for Imbalanced Data
F1 score is a balance between precision and recall:
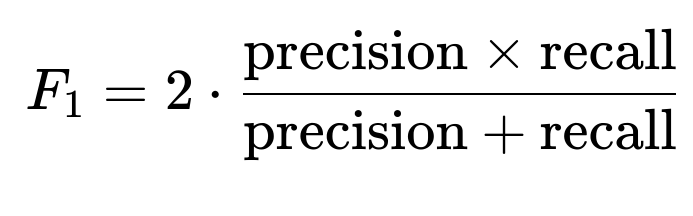
This metric is especially important if you seek a trade-off between catching as many minority instances as possible (high recall) and ensuring that your positive predictions are correct (high precision).
Obtaining More Data
If it is at all possible, collecting more samples of the minority class can mitigate imbalance. Additional data can reduce overfitting and offer more examples for the model to learn from. In practice, this may not be feasible due to time, cost, or logistical constraints, but it should not be overlooked as an initial strategy.
Sampling Methods
An immediate approach to reduce imbalance is resampling. This can be done in two fundamental ways:
Oversampling the Minority Class
By duplicating or synthetically generating instances of the minority class, the minority distribution becomes more prominent in training. Simple random oversampling replicates existing minority samples, while more advanced techniques such as SMOTE can create new, slightly perturbed examples by interpolating between existing minority instances. Oversampling can lead to overfitting if done naively, so methods like SMOTE are often preferred.
Undersampling the Majority Class
Reducing the majority class means you deliberately remove or downsample examples from the majority category. This approach can help balance data quickly, but it discards potentially useful information. You must be cautious, as excessive undersampling could remove crucial patterns.
Cost-Sensitive Approaches
Instead of modifying the dataset, you can modify the learning algorithm to penalize misclassifications of the minority class more. In many implementations of tree-based models or logistic regression, you can specify class weights. The training objective becomes more sensitive to errors on minority samples, thus forcing the model to better account for them.
Adjusting the Classification Threshold
Often, models produce a probability score. Instead of relying on a 0.5 cutoff, you can shift the threshold to increase recall for the minority class. One way to decide on an appropriate threshold is to plot metrics like precision-recall at various probability cutoffs and select a threshold that meets your desired balance between precision and recall.
Ensemble Methods
Another strategy is to build multiple models over differently sampled versions of your dataset. For instance, you could create an ensemble of models, each trained on a different undersampled or oversampled subset. By averaging or voting across models, you might capture a richer decision boundary. Techniques such as BalancedBagging, BalancedRandomForest, or specialized boosting algorithms are also well-known approaches for imbalanced data.
Real-World Caveats
One must consider that some events are inherently rare. Sometimes, it may not be feasible to gather more minority instances. Oversampling too aggressively can introduce noise, while undersampling too heavily can remove informative majority samples. Always cross-check these techniques with hold-out sets or cross-validation to ensure that the performance gains generalize rather than arise from overfitting.
Practical Example in Python
Below is a very simplified skeleton showing how you might apply SMOTE in Python. Note that this is only a conceptual illustration:
import numpy as np
from imblearn.over_sampling import SMOTE
from sklearn.model_selection import train_test_split
from sklearn.ensemble import RandomForestClassifier
from sklearn.metrics import classification_report

X = np.random.rand(1000, 10)
y = np.zeros(1000)
y[:50] = 1  # minority class of about 5%

X_train, X_test, y_train, y_test = train_test_split(X, y, stratify=y, test_size=0.2)

smote = SMOTE()
X_train_resampled, y_train_resampled = smote.fit_resample(X_train, y_train)

model = RandomForestClassifier()
model.fit(X_train_resampled, y_train_resampled)

y_pred = model.predict(X_test)
print(classification_report(y_test, y_pred))
This outline demonstrates how to handle minority class oversampling with SMOTE before feeding data into a classifier like a RandomForest.
Follow-up Question: How do you decide between oversampling and undersampling?
It depends on the size of your dataset and the relative importance of retaining all possible patterns. If your dataset is not extremely large, oversampling—especially SMOTE or similar synthetic approaches—can help you better utilize all the information. On the other hand, if you have a very large majority class, undersampling can cut down training time and reduce noise, though you risk losing valuable majority examples. In practice, experimentation with both approaches is often worthwhile, and you can compare performance on validation or cross-validation splits to find the best strategy.
Follow-up Question: When would a cost-sensitive learning approach be preferable?
Cost-sensitive approaches are beneficial when you either cannot or prefer not to alter the original distribution of your data. This might be the case in environments where the training pipeline or data pipeline is tightly controlled, or if data manipulation is expensive or restricted. By introducing class weights or a custom cost matrix, you allow the model to process the original dataset but place a heavier penalty on errors associated with the minority class. This can be especially helpful in scenarios like medical diagnostics or fraud detection, where missing a minority instance has more severe consequences.
Follow-up Question: Which metrics are most informative for highly imbalanced data?
Precision, recall, the F1 score, and the precision-recall curve (PR curve) are particularly revealing. The ROC curve can be helpful, but when classes are extremely unbalanced, the PR curve is often more insightful because it demonstrates how well the model performs at various classification thresholds specifically for the positive predictions. In other words, it conveys the balance between capturing more minority instances (recall) and ensuring predictions for the minority class are correct (precision).
Follow-up Question: How do you select the optimal decision threshold?
You generally rely on validation data or cross-validation to estimate performance under different threshold values. For example, you might compute precision, recall, or F1 score at various cutoffs (e.g., 0.1, 0.2, 0.3, ..., 0.9). You then choose the threshold that maximizes or balances the metric(s) you care about the most. Some fields, like medicine, might favor higher recall (sensitivity) to reduce false negatives, while others might place more emphasis on precision to minimize false positives. The best threshold can also be informed by business constraints such as cost or resource limitations.
Below are additional follow-up questions
How would you handle data leakage in an imbalanced classification context?
Data leakage occurs when information from the training process inadvertently includes details that should be unknown at prediction time. When the dataset is imbalanced, leakage can disproportionately affect your minority class. For example, if a certain feature is highly correlated with the minority label due to distribution shifts or improper data splitting, the model may overfit and show artificially inflated performance metrics. One common pitfall arises when temporal or future-related features are present in the training set, giving the model unfair clues about outcomes that it would not have in a real production environment. To avoid leakage, you should ensure that all preprocessing steps (such as feature engineering, scaling, or SMOTE) are performed only on training data (and never on test data), and that you maintain correct chronological splits if time series or sequential data is involved. Vigilantly checking for unrealistic performance indicators—such as extremely high precision and recall simultaneously—is also helpful. In practice, thorough validation with separate hold-out sets or cross-validation folds can expose data leakage before deployment.
How do you manage concept drift when dealing with imbalanced classes over time?
Concept drift arises when the underlying data distribution changes over time, altering the relationship between features and labels. This is especially problematic in imbalanced settings (e.g., fraud detection), because the minority class distribution can shift in subtle ways. To manage drift, you can frequently retrain or update the model using recent data so that it stays aligned with emerging patterns. Another approach involves online learning algorithms that adapt incrementally to new batches of data. You might also use a sliding window technique, where older data is gradually dropped. In each scenario, it is vital to keep track of how the minority class prevalence and behavior evolve. If the rare phenomenon changes definition or frequency, you may need to recalibrate your sampling strategies or cost-sensitive parameters. Monitoring key metrics (like recall on newly acquired data) can signal that a model update or threshold shift is required.
What are the risks of synthetic oversampling methods like SMOTE in high-dimensional spaces?
SMOTE and related techniques can become less effective or even counterproductive when the feature space is high-dimensional. In such spaces, the distance metrics used for interpolation can be less meaningful due to what is sometimes called the “curse of dimensionality,” where points can become equidistant from one another. This can lead to synthetic samples that do not accurately reflect valid data points, effectively introducing noise or confusion. Additionally, if the minority class has distinct subclusters with narrow boundaries, synthetic interpolation might generate overlapping points between subclusters or stray into regions belonging to the majority class. To mitigate this, you should consider dimensionality reduction methods (e.g., PCA) to ensure that SMOTE operates in a more compact space, or use specialized methods like SMOTE variants that are designed to handle high-dimensional or multimodal data. Rigorous validation checks are key here: if metrics degrade or variance increases, it may indicate that synthetic sampling is harming the model.
How do you deal with outliers in the minority class?
Outliers in the minority class can skew the decision boundary, especially when the dataset is already limited. If these outliers are legitimate minority class instances, discarding them could mean losing important signals about boundary cases. On the other hand, if they are data errors or noise, they might unduly distort the learned model. One approach is to perform careful outlier analysis before any resampling, using domain knowledge to verify whether suspicious points are valid. Another option is employing robust models or outlier-resistant training methods (like certain tree-based algorithms) that are less sensitive to extreme data points. Additionally, you may combine oversampling with anomaly detection techniques to identify and treat potential outliers differently—either with specialized weighting or partial filtering—so that they do not incorrectly define the minority class’s region in feature space.
Could you apply an anomaly detection approach rather than supervised classification for rare events?
Yes, if the minority class represents anomalies (e.g., fraudulent transactions or rare medical conditions), an unsupervised or semi-supervised anomaly detection method can sometimes be more natural. In anomaly detection, you generally model the “normal” pattern and then flag outliers as anomalies. This can be advantageous when you have few labeled minority examples, as anomaly detection does not always require labels for the anomalous class. However, the challenge is that not all rare classes neatly fit into the typical notion of an “anomaly.” For example, some minority class instances might share a lot of overlap with the majority class. Furthermore, if you do have reliable minority labels, a supervised approach might outperform anomaly detection by leveraging those explicit labels. Domain context is crucial for deciding when anomaly detection is suitable.
What if the ratio of the minority class changes in production compared to training?
It is quite possible that the 1% minority class in training might become 3% or 0.5% in production. Even a small difference can significantly impact model performance, especially since many sampling or threshold-tuning strategies are based on an assumption about class priors. To handle this, you could monitor the distribution shift of the classes in real-time. If the ratio drifts, you might re-tune thresholds, re-run SMOTE or undersampling, or retrain a new model that reflects the updated ratio. In some cases, you can apply Bayesian calibration methods that adjust the output probabilities to account for new priors without fully retraining. In any event, your production monitoring pipeline should track any changes in class prevalence and measure how your key metrics evolve over time.
How do you ensure that undersampling does not discard critical majority examples?
Undersampling the majority class risks losing potentially valuable data, especially if the majority class itself contains rare but crucial sub-patterns. A naïve random undersampling might remove instances that are vital for capturing the decision boundary between classes. One way to mitigate this is to use more sophisticated undersampling techniques such as Near-Miss or cluster-based undersampling, which aim to preserve examples near the class boundary. Another approach is an ensemble of multiple undersampled datasets, where different portions of the majority class are sampled each time, reducing the chance that important examples are consistently left out. Continuous monitoring of validation performance can reveal if undersampling is too aggressive, as you might see an overall drop in model performance on real-world data.
Could you discuss practical concerns when implementing class-weight adjustments in frameworks like TensorFlow or PyTorch?
When setting class weights for loss functions in TensorFlow or PyTorch, you need to be cautious about how the weighting interacts with your chosen optimizer, learning rate, and batch size. Large class-weight values can lead to unstable training dynamics, especially if the majority class ends up with a very small weight and is effectively ignored. Another concern is how the class weighting formula is derived. Some frameworks automatically normalize weights such that the average loss remains balanced, while others might require you to do it manually. Testing different weighting schemes on a validation set can help dial in the right ratio. You should also consider the possibility that class weights might not fix your data imbalance issues completely if there are other complexities, such as severe overlap in feature distributions. In that case, combining class weights with partial resampling or threshold tuning may be more effective.
How do you interpret precision-recall curves in real-world environments where the true class distribution is not stable?
Precision-recall curves are typically constructed based on the class distribution observed in the validation or test set. If your real-world distribution is constantly changing (for example, going from 1% minority to 2%), the precision and recall you measured might no longer accurately predict your model’s performance. To handle this, you can use calibration techniques or re-sample your test data to approximate the new distribution. Another alternative is to provide a range of metrics across different hypothetical prevalence rates. This helps stakeholders understand how performance might shift if the minority proportion rises or falls. Moreover, continuous evaluation in production is key: you should keep track of how model predictions fare against newly collected ground-truth labels and re-calculate the precision-recall curve at regular intervals.
Can you discuss fairness and bias issues that arise when the minority class is also a protected group?
Class imbalance may sometimes overlap with demographic biases—for instance, if your minority class is a protected group (in credit lending or hiring decisions). A model that is already struggling to represent a rare class may inadvertently perpetuate or amplify biases. Disproportionate error rates for a protected group can result from insufficient representation in the training set. To address this, you can apply fairness-oriented techniques such as reweighting methods, adversarial debiasing, or data augmentation targeted at protected groups. You would also want to analyze fairness metrics (such as demographic parity, equalized odds, or equal opportunity) in conjunction with your performance metrics. A crucial pitfall is that some standard improvements (like SMOTE) might artificially shift distributions in ways that introduce new biases or mask systemic issues. Domain expertise, stakeholder consultation, and ongoing fairness audits all play a role in mitigating these risks.