
ML Interview Q Series: How would you assess, implement, and measure the success of a 50% ride-sharing discount promotion?
📚 Browse the full ML Interview series here.
Comprehensive Explanation
A promotion involving a 50% discount on rides can affect user behavior, company revenue, and long-term loyalty. Understanding how to evaluate this promotion’s impact requires a clear experimental setup, rigorous metrics, and careful implementation.
Experimental Setup and Strategy
One common approach to assess the effectiveness of this promotion is to perform an A/B test. You can randomly assign a group of riders to receive the discount (treatment group) and another group to receive no discount or a smaller discount (control group). By analyzing the differences in behavior between these two groups, you can estimate the true effect of the 50% promotion on critical business metrics.
To quantify the impact, you can compute the difference in average outcomes (for example, average revenue per user, number of rides, or user engagement) between the two groups. This difference in means can be summarized as:
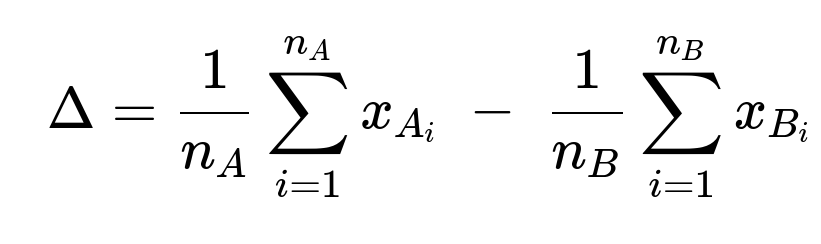
Here, x_{A_i} is the metric of interest (such as total rides taken or total spending) for the i-th user in group A (the discount group), and n_A is the number of users in that group. Similarly, x_{B_i} is the same metric for the i-th user in group B (the control group), and n_B is the number of users in the control group. The value of Δ helps determine whether there is a positive, negative, or neutral effect from the discount.
Implementation Details
One practical way to implement the discount might involve the following steps:
Randomly segment users to ensure there is no systematic bias between groups.
Communicate clearly to the discount group about the promotion and how to redeem the discount.
Ensure your analytics pipeline can collect relevant data points, including detailed ride usage, spend, and user engagement.
Run the experiment for a predetermined timeframe or until you achieve enough statistical power to detect meaningful differences.
Key Metrics to Track
Revenue Impact: Monitor the short-term revenue change. A 50% discount might increase rides but reduce revenue per ride. Observe if there is a net positive or negative effect on total revenue.
Profit or Contribution Margin: Evaluate the cost structure of each ride to see if the reduced price still covers the marginal costs. This helps confirm if the promotion remains profitable or becomes a loss leader.
Rides per User: Examine if the discount successfully increases the number of rides per user. If the promotion leads to a significant uptick in usage, it may generate network effects or brand loyalty.
User Acquisition and Retention: Check if the discount effectively attracts new users and whether these users continue to use the service after the promotion ends. A retention spike post-promotion can justify the discount’s short-term cost.
Lifetime Value (LTV) Changes: Estimate if the user lifetime value grows due to increased loyalty and ongoing ride usage. A short-term discount could have a lasting positive effect if it nudges new users into becoming regular customers.
Usage Frequency Post-Promotion: Assess if usage remains elevated after the discount ends. If ride volume reverts immediately, the promotion might not have created genuine habit-forming behavior.
Customer Satisfaction: Examine feedback or satisfaction ratings to see if riders perceive more value in your service or if they only participated because of the discount.
Possible Follow-up Questions
How would you handle situations where the promotion group significantly differs from the control group at the start?
If randomization is done properly, you typically expect both groups to be similar. However, if you notice demographic or usage-level imbalances, you could use statistical methods such as stratification (ensuring each segment has balanced representation in both groups) or covariance adjustment (such as ANCOVA) to correct for those differences.
What if the metric we care about takes a long time to show meaningful impact?
In such cases, you can conduct a longer experiment to capture enough user activity. Alternatively, you might track leading indicators. For instance, if the ultimate goal is profitability, you might still focus on near-term metrics (increased sign-ups, repeat rides over a shorter period) that can predict longer-term profitability.
Could running a discount harm brand perception or train users to expect ongoing deals?
Yes, users might grow accustomed to discounts, reducing their willingness to pay full price. One approach is to keep promotions short-term or targeted at specific user segments (e.g., newly onboarded users). Measuring brand perception through surveys or social media sentiment can provide insight into potential negative effects.
How would you isolate the effect of external factors (like seasonal demand changes) during the discount period?
You can run the control and treatment groups in parallel and apply the discount only to the treatment group at the same time. Since both groups experience the same seasonality trends, the external factors affect both groups similarly, allowing you to attribute observed differences more reliably to the discount promotion.
How might you measure the intangible effects of the discount beyond raw metrics?
Besides direct measurements (rides, revenue, etc.), you can use user satisfaction surveys, Net Promoter Score (NPS), or social media sentiment analysis. A favorable discount can improve public perception, but a careful study is needed to see if this translates into sustained growth.
What steps could you take if the A/B test suggests the discount did not increase engagement or revenue in the way you wanted?
You can consider adjusting the discount terms (for example, a smaller discount or restricting usage to certain off-peak times), testing targeted campaigns for selected user segments, or rethinking the messaging around the discount. You might also investigate user feedback to see if users are motivated by other factors (like loyalty points, convenience, or new feature rollouts) rather than just cost savings.
Implementation Example in Python
import numpy as np

# Suppose we have user spend data for control and treatment groups
control_data = np.random.normal(loc=20.0, scale=5.0, size=1000)   # average $20
treatment_data = np.random.normal(loc=22.0, scale=5.0, size=1000) # average $22

# Compute difference in means
delta = np.mean(treatment_data) - np.mean(control_data)
print("Difference in Mean Spend (Treatment - Control):", delta)

# Further statistical tests (e.g., t-test) can be performed:
from scipy.stats import ttest_ind

statistic, pvalue = ttest_ind(treatment_data, control_data, equal_var=False)
print("T-test statistic:", statistic)
print("P-value:", pvalue)
This code snippet shows a simple approach to measuring the difference in spending. In a real-world setting, the data would be carefully collected during the experiment, and you would examine other key metrics beyond just spending.
By tracking robust metrics and analyzing them thoroughly, you can determine whether the 50% discount yields a sustainable uptick in user behavior or if it simply erodes margins without a long-term benefit.
Below are additional follow-up questions
How would you handle the possibility that the 50% discount might motivate fraud or misuse?
Fraud can occur if users repeatedly exploit the promotion or create multiple accounts to keep receiving the discount. This kind of misuse can artificially inflate usage metrics, making it appear as though the discount is driving more engagement than it actually is.
One approach is to implement identity verification checks. You might require a verified email and phone number, then limit the discount to one account per phone number or per payment method. You could also leverage machine learning models to detect suspicious activity by looking at ride patterns, IP addresses, and device fingerprints.
A significant pitfall is that overly strict fraud checks may raise friction for legitimate users. If the verification process becomes cumbersome, genuine users might abandon the promotion or the platform altogether. Hence, you need to strike a balance—tight enough fraud controls to protect against abuse, yet still user-friendly for legitimate customers.
In addition, you should continuously monitor usage metrics in near-real-time. If you detect sudden spikes in new accounts from the same region or multiple rides booked within very short intervals on newly created accounts, you can automate a “flag and review” process. This ensures fraudulent activities are promptly identified, potentially preserving the integrity of your experiment or overall promotion.
How can you account for driver satisfaction or driver availability issues stemming from a discounted fare?
A discount might inadvertently lower drivers’ earnings if the company does not adjust driver reimbursement accordingly. If drivers’ per-ride payouts are partially tied to rider fares, a large discount could create driver dissatisfaction or even reduce driver availability.
One solution is to subsidize driver payouts at a level unaffected by the discount—i.e., treat the discount as a marketing cost rather than passing the cost on to drivers. However, this increases the company’s promotion expenses.
Monitoring driver metrics becomes critical:
Average earnings per hour: A steep reduction in fares might drive away experienced drivers if their income falls.
Driver retention rate: If too many drivers leave, ride completion times may rise and service quality might decline.
Supply-demand balance: An under-supply of drivers causes increased wait times, which damages customer satisfaction and undercuts the discount’s intended effect.
When measuring the overall success of the promotion, incorporate these driver metrics. The experiment should track not only user engagement and revenue but also driver satisfaction or churn to ensure a stable supply side.
How do you evaluate if user demand is price-elastic or price-inelastic in this promotion?
Price elasticity of demand refers to the sensitivity of ridership volume to changes in price. If a small change in price causes a large change in quantity of rides, demand is highly elastic, suggesting the discount might significantly boost usage. Conversely, if ridership hardly changes when price changes, demand is more inelastic, meaning the discount may not yield as large an impact in terms of added rides.
One way to quantify this is by calculating the price elasticity of demand:

Where:
ΔQ is the change in total rides (or average rides per user).
Q is the original number of rides.
ΔP is the change in price (which would be -50% for a 50% discount).
P is the original price.
A result |E_d| > 1 suggests highly elastic demand (a large change in quantity relative to the change in price). If |E_d| < 1, demand is more inelastic.
In real practice, you use the results of the A/B test to estimate changes in Q (number of rides) as a function of changes in P (the discount). This analysis can be complicated if multiple other factors—like competitor promotions, seasonal factors, or macroeconomic shifts—also affect ridership. It’s critical to have a control group not receiving the discount so you can isolate the elasticity effect tied specifically to your promotion.
A pitfall is assuming elasticity is constant across user segments. Some rider groups (e.g., price-sensitive students) might exhibit high elasticity, while others (e.g., business travelers) may be largely indifferent to price changes. You might need a segmented analysis rather than a single elasticity measure.
What if there is a strong confounding factor, such as a competing promotion launched by a major competitor?
External market forces can dilute or obscure the effect of your own discount. For example, if a competitor offers a bigger discount simultaneously, your promotion’s ability to attract or retain users might be significantly affected.
One way to address this is to run your test for multiple geographies or time periods. You can compare regions or time windows where competitor effects are more or less present. If your competitor’s promotion is region-specific, consider isolating unaffected areas as a baseline.
You might also collect user feedback on why they chose or did not choose the service. If user exit interviews or surveys indicate they went to a competitor for a better deal, you can factor that into your analysis.
A potential pitfall is misinterpreting the data. If your metrics show a negligible bump from the discount, it might not necessarily mean the discount was ineffective; it could be overshadowed by the competitor’s concurrent promotion. In that case, you must either broaden your discount strategy or run a test at a different time when competitor promotions are not in play.
How do you ensure fair treatment of users while still running an experiment with a limited discount group?
Fairness and ethics come into play when some users receive deep discounts and others do not. If your platform publicly advertises equal pricing, it could be perceived as unfair if only select groups benefit from a 50% discount.
One mitigating strategy is to use randomization carefully and be transparent about how the experiment is conducted. For instance, you might communicate that a random group of users has been selected for a limited-time test promotion. Another approach is to run time-split tests: Offer the discount to everyone, but only in specific weeks or weekends.
You must also consider legal and compliance issues. In certain jurisdictions, promotional pricing might have regulatory constraints. Always verify you are not breaching any rules on discriminatory pricing.
A subtle pitfall is that frequent riders who don’t receive the promotion might feel alienated. They may have a high lifetime value but switch platforms if they feel they are treated worse than new or less active users. Balancing these user perceptions can be as critical as the experimental design itself.
How can you detect and handle diminishing returns if the discount is offered repeatedly?
Over time, repeating the same discount might reduce its effectiveness. Users may become desensitized to it or expect permanent lower prices, undercutting the perceived value of your service at regular prices.
One way to assess diminishing returns is to observe metrics over multiple promotion cycles. If you see that each subsequent run of the discount yields a smaller marginal increase in ridership or revenue, you have evidence of saturation.
Additionally, user surveys can reveal whether your customers now view the 50% discount as an entitlement rather than a special incentive. The result might be that users wait for another 50% discount before they ride again.
Edge cases:
If the discount is offered continuously to certain segments, they might never pay full fare, drastically lowering your average revenue per user in that segment.
Power users might exploit repeated promotions, leading to less profitability without genuinely increasing ridership in the long run.
In response, you might rotate different promotions (e.g., a loyalty points system or a discount for off-peak hours only) or use a tiered approach that rewards consistent use over time without relying on the same large discount repeatedly.
What if the experiment data shows significant variance in impact across different cities or time periods?
The effect of a promotion can vary widely by location and time. Urban centers with more alternatives (public transit, bike-share) might display higher price sensitivity than suburban areas. Likewise, a holiday season might naturally boost ridership, masking the promotion’s actual effect.
A recommended tactic is to segment your results by city, region, or time. Examine differences in effect size between segments. If certain segments show strong positive impact, it might make sense to continue the discount there, while discontinuing it in low-impact areas.
A subtle challenge is deciding how to aggregate these segmented results without losing the nuances that come from local or seasonal factors. When measuring an overall average effect, big city usage might dominate your numbers and distort insights from smaller markets. This underscores the importance of stratified analysis: not only do you look at the global mean effect, but you also examine each sub-population to reveal localized trends.
How do you integrate the cost and complexity of implementing the discount into your final assessment?
A large discount might require additional marketing spend to publicize, engineering resources to develop discount codes and manage eligibility, and customer support to handle inquiries. These overheads reduce the net benefit that might come from increased ridership.
You can estimate total promotion cost by summing:
Direct discount cost: The difference in price multiplied by the number of discounted rides.
Marketing expenses: The budget spent to advertise or notify users about the promotion.
Operational overhead: Engineering and customer support hours specific to the promotion.
If the discount is only being tested, weigh the experiment’s running cost against the potential upside. A crucial risk is underestimating the peripheral expenses. For example, if the promotion triggers a surge in new sign-ups, your customer support might suddenly need more staffing or your system might need scaling to handle higher demand—both of which incur additional cost.
By carefully enumerating all these implementation costs and comparing them with incremental gains (long-term revenue uptick, higher user retention, brand value increases), you can make a data-driven decision on whether the promotion’s net impact is truly positive.