
ML Interview Q Series: How would you design an A/B test to evaluate if a subscription price increase benefits a B2B SaaS firm?

📚 Browse the full ML Interview series here.
Comprehensive Explanation
Designing an A/B test for a price increase requires careful consideration of how to randomize users, select appropriate metrics, and isolate the impact of the price change. In a subscription-based environment, the key question is how changes in price affect both user acquisition and retention. Below are the main elements that guide an effective design and interpretation strategy, explained in depth:
Randomization Strategy and Group Allocation
When designing the experiment, the user pool (potential or existing users) is typically split into two segments. The control group sees the existing subscription pricing, while the treatment group encounters the increased pricing. Because pricing can strongly influence user decisions, it is crucial to ensure that the randomization process yields comparable groups to minimize biases.
In many B2B contexts, the purchasing process might involve multiple stakeholders or longer cycles. One must ensure the groups remain stable throughout this time. Whenever possible, randomize at the level of the account or organization to prevent interactions between test and control users within the same company.
Sample Size and Statistical Power
One of the first steps is to calculate the required sample size for the test so that the analysis can detect meaningful differences in relevant metrics. The test duration (two weeks in this scenario) may or may not suffice, depending on the average traffic or number of leads.
Deciding on a metric such as conversion rate from trial to paid plan, total revenues, or average revenue per user (ARPU) is essential. Because higher prices might reduce conversion while increasing revenue per converted user, ensure you have enough participants in each group to detect such differences with statistical confidence. If traffic is limited, consider extending the test beyond two weeks.
Primary Metrics for Evaluation
Common metrics in a B2B SaaS context include trial conversion rate, subscription conversion rate, and average revenue per user or per account. One might also want to track churn rate, as higher prices could push current customers to downgrade or leave. Overall, the metric of interest typically revolves around revenue or projected lifetime value (LTV).
Sometimes a combined metric, such as net revenue per lead, offers a more complete view of how the new pricing structure impacts profitability. Net revenue per lead takes both conversion probability and price level into account. If price increases cause a heavy drop in conversion, net revenue might decrease. Conversely, if revenue from the paying fraction more than compensates for lost leads, net revenue could rise.
Hypothesis Testing
To determine if the difference between the groups is statistically significant, a typical approach involves a difference in means test (z-test or t-test) or a nonparametric alternative if the data is skewed. If the primary metric is revenue per user, one might use a standard hypothesis test for mean difference.
Below is an example of the test statistic (assuming approximate normality and large enough sample sizes). Here, x_1 is the average metric (e.g., revenue per account) for the control group, x_2 is the average metric for the treatment group, sigma_1^2 and sigma_2^2 are their variances, and n_1 and n_2 are sample sizes:

In this context, x_1 - x_2 would be the difference in average revenue or conversion metrics (control minus treatment or vice versa). The denominator is the standard error of this difference. If the absolute value of T is large enough relative to a chosen significance level, one concludes that the difference in means is statistically significant.
Understanding the Business Implications
Statistical significance by itself does not guarantee that the new price is beneficial to the business in the long term. Even if the price increase yields higher short-term revenue, it may negatively affect churn or brand perception later. Conduct a deeper analysis of factors such as customer lifetime, upsell potential, and feedback from prospects who did not convert. Look for any shifts in user quality or usage patterns that could appear after the test’s limited duration.
Implementation Details in Code
In a real-world scenario, you might store test group allocations and outcomes in a database, then analyze results in Python. Here is a short illustration of how you might do a simple difference in means test using a t-test:
import numpy as np
from scipy import stats

# Assume revenue_control and revenue_treatment are arrays
# of individual user revenues (or leads if user does not convert => 0).
# Both arrays will be of the same shape or different shapes
# but each corresponding to the same timeframe.

t_stat, p_value = stats.ttest_ind(revenue_control, revenue_treatment, equal_var=False)

# Interpret the p-value, see if it's below a significance threshold (e.g., 0.05).
if p_value < 0.05:
    print("Statistically significant difference. T-stat:", t_stat, "P-value:", p_value)
else:
    print("No statistically significant difference. T-stat:", t_stat, "P-value:", p_value)
This code snippet uses the independent samples t-test to see if the means for the two groups differ significantly, assuming you have numeric outcomes like revenue per user or revenue per account.
Edge Case Considerations
One must ensure that existing customers are not inadvertently exposed to the new price if they are in the control group. Another subtlety is whether the price increase might distort user behavior in ways that are not captured within two weeks—for instance, potential customers may delay their decision to purchase because they see a higher price.
It is also vital to consider how promotional or discount codes might interfere with true pricing exposure. If the B2B SaaS platform typically negotiates custom contracts, the test might require additional constraints to keep the experiment clean.
How would you account for variations in user behavior over time?
User behavior may fluctuate because of seasonality, marketing campaigns, or economic trends. If you rely on only two weeks of data, you risk capturing an unrepresentative snapshot. A robust approach is to track the cohorts beyond the initial purchase to see if churn or upgrade/downgrade patterns differ between the control and treatment groups. One could also look for large cyclical variations in usage or sign-ups and adjust the experiment schedule to avoid known seasonal spikes.
How do you manage potential ethical or reputational risks from different prices for different users?
In a B2B environment, some buyers might feel they are being treated unfairly if they discover others got a lower price. Clear communication and gating the experimental cohort (e.g., only new leads see the test price) can mitigate these concerns. Additionally, an internal policy might be needed to address objections from prospects who see different prices.
What if statistical significance conflicts with practical business significance?
It is possible to see a statistically significant increase in short-term revenue if you raise prices, but the margin of improvement might be too small to offset potential negative side effects like churn or customer dissatisfaction. This is why you must compare the effect size with practical business thresholds—such as whether an observed 2% revenue increase justifies potential brand damage or leads to a lower conversion from new accounts.
How would you extend the test if the sales cycle is longer than two weeks?
In many B2B contexts, sales cycles can last much longer, meaning a two-week window might not capture the full conversion funnel or usage patterns. For more conclusive insights, extend the A/B test to align with the average cycle or track early-phase metrics (like leads from marketing to conversation with sales) and subsequent stages. Ultimately, a multi-phase measurement strategy, verifying both short-term interest and long-term retention, yields more reliable results for pricing decisions.
How would you handle free trial users who have not converted within the testing period?
Some B2B SaaS businesses offer free trials that can last longer than two weeks. In that situation, you would either extend the experiment to observe the eventual conversion for these users or use leading indicators like trial-to-paid upgrade intention. You can also design the experiment so that only those who begin a trial within a specific timeframe are included, then wait until the end of the trial window to finalize the results.
How do you factor in customer lifetime value (LTV) as opposed to immediate revenue?
In many B2B businesses, the key is not just the immediate revenue gain but the net present value of a customer over the entire relationship. When analyzing the data, consider churn rates, upsell potential, renewal probabilities, and any discounting dynamics. The net impact of a price increase could be measured more accurately by projected LTV rather than short-term revenues alone. The two-week test, in that sense, must feed into longer-term analyses to reveal comprehensive financial impact.
Below are additional follow-up questions
How would you handle the possibility of selection bias if certain leads or customers self-select into higher or lower pricing tiers?
Selection bias might occur if customers exposed to the higher pricing tier systematically differ from those exposed to the standard pricing in ways that impact conversion and revenue. Even if you randomize individuals into control (original price) and treatment (increased price), there can be a scenario in which potential buyers become aware of alternate pricing or find creative ways to get into a lower-price group. This dilutes the integrity of the random assignment.
If you suspect or detect selection bias, you might need to: • Implement more robust randomization to prevent self-selection (e.g., requiring a unique test code or gating the experiment at the landing page). • Track user behavior rigorously to see if certain demographic or usage patterns are disproportionately in one group. • Adjust your final analysis with post-stratification, matching, or weighting techniques to account for differences in observed user characteristics between the groups.
In a B2B context, you could also see selection bias if some corporate clients negotiate personalized rates. In that situation, you must carefully isolate the experimental population from those who request custom pricing or have enterprise-scale deals.
How would you measure the impact of the pricing test on upsells and cross-sells for existing customers?
Higher prices might affect not only initial subscriptions but also add-on products, premium support packages, or feature-based tiers. To evaluate the broader business impact, collect data on upsells and cross-sells for each experimental group over time. Higher initial pricing could potentially anchor customers to a higher price point, making them more (or less) likely to purchase additional features.
In your data structure, maintain clear identifiers for each customer to determine which group they originally belonged to, then track all subsequent purchases. Calculate the incremental revenue from upsells or cross-sells as part of the overall lifetime value. This can be especially important in B2B contexts where a single customer might eventually spend significantly more than the initial subscription price.
How would you account for a situation where only a small portion of users see the new price and traffic is limited?
When traffic or user volume is small, achieving the required sample size for statistically significant insights becomes difficult. If the expected difference in revenue is subtle, you risk failing to detect it due to high variance. In these cases, you could: • Extend the experiment duration beyond two weeks to accumulate more data. • Combine multiple similar user cohorts or segments to increase sample size, while still keeping an eye on whether these combined cohorts are genuinely similar in purchase behaviors. • Use hierarchical Bayesian methods or other advanced statistical approaches that can be more data-efficient than classical tests.
It might also be worthwhile to implement sequential testing methods, where you continuously monitor results and have a plan to stop the test early if the observed difference is dramatic or continue longer if results are inconclusive.
How do you evaluate the impact on customer retention if the subscription renewal cycle is longer than the test period?
When renewal cycles are longer (e.g., annual plans), a short test might not capture the true effect on retention. You must distinguish between immediate purchase reactions and longer-term renewal decisions. Potential approaches: • Use leading indicators that correlate with retention, such as product usage metrics, early churn signals, or NPS scores. • Track the test group’s renewal outcomes over time, even after the official two-week test window ends. You could keep the price stable for that cohort and measure actual renewal rates when they come due. • Conduct cohort analysis for newly acquired customers under the test condition vs. those under the original condition. If a pattern of churn emerges, it might signal that the higher price has adverse effects on long-term retention.
What strategy would you adopt if you observe strong heterogeneity in conversion rates across different customer segments or industries?
In B2B SaaS, conversion and price sensitivity can differ vastly among industries or company sizes. If aggregated data shows minimal or inconsistent price sensitivity, you might uncover a clearer pattern by segmenting. For instance, enterprise-level clients might not be as sensitive to a modest price increase, whereas small businesses could respond strongly. To handle this: • Segment the data by relevant dimensions (e.g., SMB vs. mid-market vs. enterprise). • Conduct separate hypothesis tests or a stratified test design. • Investigate whether dynamic or tiered pricing is more appropriate, offering different prices to different segments.
You might also consider building a price elasticity model that takes into account how changes in price affect each segment’s likelihood to purchase and continue the service.
How would you deal with outliers, such as extremely large deals or high-spending customers, in your revenue metrics?
In a B2B context, it is not uncommon for a few large enterprise accounts to skew average revenue metrics. One giant contract in a single test group may dominate the average, potentially giving a misleading signal about the broader user base.
You can address outliers by: • Using trimmed means or winsorized means, which limit the influence of extreme values. • Analyzing the median revenue as a more robust statistic. • Performing separate analyses: one for smaller deals and another for large enterprise deals.
Outliers might reflect genuine business value, so do not dismiss them without careful thought. The main aim is to ensure you do not draw broad conclusions from a small subset of extraordinary deals.
How would you approach the test if your B2B SaaS deals often involve negotiated pricing rather than a fixed subscription cost?
Some B2B companies regularly negotiate pricing based on customization, user seats, or service level. This can make a simple A/B test challenging. You might need to do the following: • Define a clear “list price” or “starting price” for the test. The negotiation then starts from either the control or the higher test list price. • Train or brief the sales team to handle the experimental price in the same manner they would for the control group, avoiding partial application of the test condition. • Track the final contracted price after negotiation to see if the higher “anchor” leads to systematically higher final deals.
Even if you see that the final negotiated price is higher in the test group, also measure close rates and the length of the sales cycle to ensure you are not creating friction that reduces the total number of deals.
How do you manage partial exposure in an organization where different stakeholders see different pricing pages or get different quotes?
In complex B2B sales, multiple stakeholders might evaluate your product at different times. If half the stakeholders see the standard price and others see a higher experimental price, confusion can arise. You could create a unified environment where: • Each account is assigned to either control or treatment before they even interact with the sales material. • All relevant marketing materials and quoted prices for that account remain consistent, regardless of which stakeholder logs in. • Access is restricted such that external stakeholders cannot “browse” or discover the alternate price group.
For large accounts with multiple contact points, coordinate your sales and marketing teams to ensure consistent messaging and measure potential changes in close rate due to perceived inconsistency or confusion over pricing.
How would you construct confidence intervals around a proportion-based metric (e.g., conversion rate) to quantify uncertainty?
When dealing with proportion metrics like conversion rates, confidence intervals help show the range of plausible values for each group. Below is the expression for a simple difference of two proportions (control p_c vs. treatment p_t), assuming large enough samples for normal approximation:
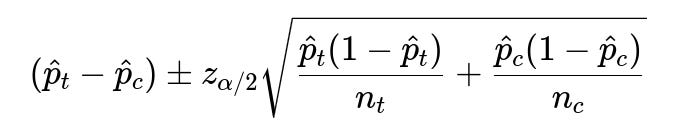
Where: • hat{p}t and hat{p}c are the observed conversion rates for the treatment and control groups. • n_t and n_c are sample sizes for the treatment and control groups. • z{\alpha/2} is the critical value from the normal distribution (for a 95% confidence interval, z{0.025} is approximately 1.96).
If this interval straddles zero, you may conclude the difference is not statistically significant at that confidence level. However, if the entire interval is above zero (or below zero), that indicates the difference is both statistically significant and suggests a direction (positive or negative). In a B2B environment with smaller numbers of deals, validating normal approximation assumptions can be tricky, so sometimes a Bayesian or exact approach (like Fisher’s exact test) might be more accurate.
How do you maintain experiment integrity when running multiple tests concurrently, including non-pricing A/B tests?
Running multiple concurrent experiments can lead to interference if test variants overlap or if the same users are being exposed to multiple changes. To mitigate these problems: • Plan an experimentation roadmap so that critical tests (like a pricing test) either run in isolation or have minimal overlap with other major changes. • Use multi-factor experimental designs or gating rules so that no single user sees a conflicting set of test conditions. • Assign experiments different user segments, but be mindful of how segmentation might bias results if the segments do not represent the overall user base.
Experiment orchestration tools can help manage test collisions and track how each user is assigned across potentially numerous experiments.