
ML Interview Q Series: How would you select the top 1,000 businesses from 100,000 for outreach as a credit card company?

📚 Browse the full ML Interview series here.
Comprehensive Explanation
A practical approach to determine which 1,000 businesses to target involves systematically analyzing and ranking potential merchants based on data-driven predictions of their likelihood to accept the credit card and the resulting profitability. The overall strategy can be broken into key steps involving data collection, feature engineering, modeling, and evaluation.
Data Collection and Feature Engineering
Gather all relevant attributes that could help you assess the expected success of partnering with each merchant. Examples include business size, industry, credit card acceptance patterns, average transaction volume, location demographics, and any historical relationship data. Transform these attributes into meaningful features that capture the nature of each small business. Typical transformations include log-scaling revenue-related features or standardizing numeric variables.
Modeling Approach
One way to formalize the problem is to estimate the expected profit from reaching out to each merchant. This can involve predicting two main quantities:
Probability that a given merchant will start accepting the card (p_i).
Expected transaction volume (v_i) or revenue once the card is accepted.
When combined with margin (from transaction fees or interest) and any operational cost_i associated with the acquisition, you can compute a profitability score for each merchant. A possible formula for the expected profit for merchant i is:
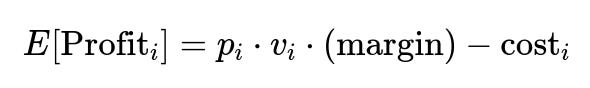
where p_i is the probability of merchant i signing up for the card, v_i is the expected transaction volume if they accept, margin is what the company earns per unit of transaction, and cost_i reflects expenses such as marketing or follow-up costs.
Probability Estimation
A model such as a logistic regression, random forest classifier, or gradient boosting classifier can be used to estimate p_i. The input features are merchant characteristics (industry, past acceptance behavior, transaction histories if available, etc.). The output is a probability of sign-up.
Volume Estimation
Once you predict p_i, you can separately model the expected volume v_i. This could be done with a regression model (linear regression, random forest regressor, or gradient boosting regressor) using historical volume data, location parameters, and business type. For merchants with no direct transaction data, you might use data from similar merchants as a proxy.
Ranking and Selection
Compute the expected profit score E[Profit_i] for every merchant in the database and rank them from highest to lowest. Select the top 1,000 businesses, as these are the most likely to yield the highest return for your outreach efforts.
Simple Python Modeling Example
Below is a simplified illustration in Python using scikit-learn, assuming you have a training dataset df with features (X) and a label indicating whether the merchant signed up (y_sign_up), as well as a target numeric variable for transaction volume (y_volume) for those that accepted.
import pandas as pd
from sklearn.model_selection import train_test_split
from sklearn.ensemble import RandomForestClassifier, RandomForestRegressor

# Example dataset with merchant features
df = pd.read_csv("merchants.csv")

# Features and targets
X = df.drop(columns=["sign_up", "transaction_volume"])
y_sign_up = df["sign_up"]
y_volume = df["transaction_volume"]

# Split data
X_train_class, X_test_class, y_train_class, y_test_class = train_test_split(X, y_sign_up, test_size=0.2, random_state=42)
X_train_reg, X_test_reg, y_train_reg, y_test_reg = train_test_split(X, y_volume, test_size=0.2, random_state=42)

# Classifier for probability of sign-up
clf = RandomForestClassifier(n_estimators=100, random_state=42)
clf.fit(X_train_class, y_train_class)
p_sign_up = clf.predict_proba(X_test_class)[:, 1]  # Probability of sign-up

# Regressor for expected transaction volume
reg = RandomForestRegressor(n_estimators=100, random_state=42)
reg.fit(X_train_reg, y_train_reg)
v_pred = reg.predict(X_test_reg)

# Example margin and cost assumptions
margin = 0.03
cost = 50

# Combine into expected profit = p_sign_up * volume * margin - cost
expected_profit = p_sign_up * v_pred * margin - cost

# Rank merchants by expected profit
result_df = pd.DataFrame({
    "merchant_id": X_test_class.index,
    "p_sign_up": p_sign_up,
    "v_pred": v_pred,
    "expected_profit": expected_profit
})

# Sort by descending expected profit
result_df.sort_values(by="expected_profit", ascending=False, inplace=True)

# Take top 1000
top_1000_merchants = result_df.head(1000)
print(top_1000_merchants)
In a real-world scenario, you would train the classifier and regressor on the same set of merchants with known outcomes or use a multi-stage modeling approach if partial outcomes are available.
Practical Considerations
Data availability: Some merchants may not have significant transaction history or relevant industry data. Imputation techniques or external data sources can help fill these gaps.
Business constraints: Regulatory or compliance constraints might limit the outreach or weigh some businesses differently based on risk. Incorporate these constraints into the ranking or discard merchants that are ineligible due to known restrictions.
Bias and fairness: Ensure the model does not unfairly prioritize or exclude certain merchant segments. This might involve analyzing model decisions by demographic or geographic subgroups.
Incremental strategy: Evaluate the performance of the outreach plan continuously. For example, track acceptance rates, subsequent transaction volume, and refine your model after each batch of merchant outreach.
Potential Follow-up Questions
How would you handle a lack of historical data on the merchants?
One approach is to leverage proxy data. For instance, gather external data about each merchant’s business type, regional economic indicators, or location-based business density. You could also cluster merchants by similarity to other companies whose acceptance data you do have. If truly no data is available, you might adopt rules-based heuristics or rely on publicly available segment-level statistics (like average volumes in certain industries).
How would you measure the success of your outreach strategy?
Determine clear success metrics in advance, such as the overall acceptance rate among the contacted 1,000 businesses, the increment in total transaction volume from those newly enrolled merchants, and the net profit gained after factoring in outreach costs. Compare actual outcomes to your model’s predictions over time to assess its accuracy and refine future campaigns.
What techniques can you use to avoid overfitting the model?
Techniques include proper train-test splits, cross-validation, hyperparameter tuning, and careful feature selection or regularization. It also helps to track metrics like ROC AUC or Precision-Recall AUC on held-out test sets. If performance on the test set deviates significantly from training, it indicates potential overfitting.
What if the company wants to maximize some other metric, like total transaction volume rather than profit?
Adjust the objective function. Instead of focusing on profit margin minus costs, optimize expected transaction volume. Use the same modeling approach but swap out the expected profit score for expected volume or any other relevant metric. The selection step then simply picks merchants that yield the highest expected volume.
How would you incorporate domain expertise into the model?
Work closely with internal or external industry experts to understand business nuances. For instance, certain merchant types might have seasonal spikes that inflate predicted volumes if the model was trained only on data from part of the year. Subject matter experts can also highlight factors like local competition or neighborhood demographics that significantly impact acceptance likelihood.
How do you handle imbalanced data if only a small fraction of merchants typically accept the card?
Use methods such as oversampling the minority class (e.g., SMOTE), undersampling the majority class, or applying class weights within the model. This ensures your model properly learns patterns from both classes without being overwhelmed by negative examples.
What is your deployment and monitoring process?
After training and selecting the top 1,000 merchants, ensure the model is deployed into a pipeline that regularly fetches updated data, scores merchants, and automatically adjusts the outreach list as new data arrives. Monitor key performance indicators such as sign-up rates, false positive rates, and calibration of predicted probabilities. If performance drifts, retrain the model with fresh data.
All these elements, from thorough data gathering to careful evaluation, contribute to a robust framework for identifying which 1,000 merchants to reach out to for the highest likelihood of success.
Below are additional follow-up questions
How would you handle merchants whose behavior or likelihood to accept can drastically shift over time (e.g., due to economic changes or evolving business models)?
One pitfall is that your historical data may no longer be representative of current conditions. This can lead to poor performance if there is a distribution shift (also called concept drift) in the merchant features or response patterns. Possible strategies include:
Periodic Retraining: Schedule frequent model retraining sessions to capture new trends. If monthly data is available, reevaluate model performance and retrain when accuracy drops.
Rolling Window Validation: Use time-based cross-validation to ensure your model is tested on more recent segments. If the model does well on older data but fails on recent data, you know you have drift.
Adaptive Models: Consider online learning or incremental learning methods that update model parameters as new data arrives. This approach can handle real-time changes in merchant behavior more gracefully.
Drift Detection: Implement statistical tests or use specialized metrics to detect data drift. If a significant change in feature distribution is observed, trigger model retraining or an alert.
Edge case to consider: A sudden, systemic shock (like a pandemic) can render all historical data less relevant. Adaptive frameworks are essential in such scenarios.
What if outreach costs (e.g., marketing costs, time to contact) vary greatly across different merchant segments?
You might have separate cost profiles for merchants of different sizes or industries. If one segment is more expensive to target (maybe they require in-person visits), your model should factor in these cost differences.
One way to address it is to incorporate segmented costs into your expected profit equation. For merchant i, cost_i might be higher or lower based on region or merchant size. You can group merchants according to these cost bands and adjust the cost term accordingly:
Weighted Ranking: Adjust the rank by dividing by or subtracting the segment-specific cost. Even if a merchant has high volume potential, if that segment’s cost of outreach is extremely high, it could reduce overall ROI.
Sensitivity Analysis: Vary cost assumptions and evaluate how stable the chosen top 1,000 is. If a slight change in cost structure dramatically changes your ranking, your model might be too sensitive or uncertain in its estimates.
A corner case: Some merchants might have extremely low cost due to preexisting relationships or automated onboarding channels. This could create an outsized preference for that group if not handled carefully.
How would you factor in brand synergy or intangible benefits that are not directly captured by a pure profit model?
Sometimes partnering with a well-known or innovative merchant could have an indirect effect on the brand’s appeal, even if the immediate transaction volume is not the largest. Approaches include:
Qualitative Scoring: Combine a purely quantitative profit model with an expert-driven “brand synergy score.” The final ranking might be a weighted sum of the expected profit and intangible value.
Proxy Measures: Capture intangible benefits in numeric features if possible. For instance, a large social media following or an influential location might proxy for intangible benefits.
Scenario Analysis: You can run multiple versions of the ranking—one purely profit-focused, one synergy-focused—and compare outcomes to guide final decision-making.
Edge case: Overemphasis on intangible factors can lead to ignoring straightforward high-profit targets, so ensure the weighting is balanced and justifiable.
What if certain merchants have partial acceptance due to customer loyalty or specific usage patterns, making the binary “accept/do not accept” model insufficient?
In many real-world cases, a merchant might accept the card but only for certain products or specific customer segments. A purely binary acceptance variable might oversimplify. You could:
Model Acceptance Levels: Instead of a single sign-up probability, model different “levels” of acceptance (e.g., partial acceptance vs. full acceptance). A multi-class classification or hierarchical model might be used.
Weighted Transaction Volume: Consider the fraction of transactions that might realistically be routed to the card. For instance, if 50% of the merchant’s customers are loyal to another network, your expected volume might need to be halved.
Behavioral Analysis: If you have data on how acceptance ramped up for similar merchants, incorporate a time-dependent acceptance curve.
Edge case: Handling partial acceptance can get complex if your data infrastructure only labels merchants as either “accepted” or “not accepted,” forcing you to approximate partial acceptance rates or rely on external data.
How do you tackle the situation where focusing on high-expected-profit merchants might create geographic or market imbalances?
Maximizing profit alone might cause you to cluster outreach in certain high-income regions or well-established businesses, missing out on broader market coverage. Potential solutions:
Constraint-Based Optimization: Impose constraints on the selection process. For example, ensure a minimum number of merchants from each region or sector to maintain coverage.
Fairness Metrics: Just as fairness is discussed with demographic variables, you can similarly apply fairness constraints across geographical or business-type categories.
Weighted Objectives: Combine the expected profit metric with coverage metrics. For instance, you might create a composite score = alpha * (expected profit normalized) + beta * (coverage or diversity metric).
Edge case: Overly strict coverage constraints might force you to include low-profit merchants, so you need to tune these trade-offs carefully.
How would you incorporate real-time feedback from the ongoing outreach campaign into your model selection?
Once you begin contacting businesses, you collect fresh data on response rates, acceptance, and subsequent transactions. This live feedback can be invaluable:
Online Updating of Probabilities: Each merchant’s acceptance or refusal can be used to recalibrate the model. If acceptance rates deviate from predicted probabilities, you might adjust your estimates across similar merchants.
Bayesian Updating: Use prior probabilities of sign-up from the model, then update those probabilities as new evidence (merchant responses) arrives. This iterative approach refines p_i at runtime.
Adaptive A/B Testing: Randomly select a small percentage of merchants to receive different outreach strategies (e.g., a specific marketing channel or discount). Measure which approach yields higher acceptance or volume and update your approach for the rest.
Edge case: The feedback loop might be slow if merchants take time to decide. You need to balance immediate reactivity with longer-term acceptance data to avoid large swings in the model.
What if the model’s complexity makes it difficult for stakeholders to interpret why certain merchants are picked?
Lack of interpretability can be a serious drawback, especially for stakeholders who must justify why particular merchants were chosen. Possible remedies:
Interpretable Models: Consider simpler algorithms (e.g., linear or logistic regression) with carefully engineered features. Although they might be less accurate than black-box models, they can yield more explainable decisions.
Explainability Tools: Use post-hoc interpretability methods like SHAP (SHapley Additive exPlanations) or LIME to highlight which features most influence the merchant score. Stakeholders can see the top factors driving a high or low predicted profit.
Model-Agnostic Summaries: Provide stakeholder-friendly dashboards that display factor contribution (like location, merchant size, industry) in plain language.
Edge case: Even with interpretability layers, some advanced ensemble methods may remain too opaque for risk-averse stakeholders. In that case, you might trade off some predictive performance for a more transparent approach.
Which sampling or evaluation strategy do you use when the proportion of accepting merchants is extremely low?
If the fraction of merchants that eventually accept is small, standard train/test splits might fail to evaluate the model adequately. Some strategies:
Stratified Sampling: Ensure that your training and testing sets contain representative proportions of positive (accepting) and negative (not accepting) outcomes to avoid skewed distributions.
Precision-Recall Focus: When the acceptance rate is low, metrics like accuracy can be misleading. Prioritize metrics such as Precision-Recall AUC or F1 score.
Nested Cross-Validation: For high-stakes decisions with limited data, use nested cross-validation to reduce bias in hyperparameter tuning and produce more reliable performance estimates.
Edge case: If you oversample or undersample too aggressively, the distribution in your model training might diverge from reality. Make sure to correct for any sampling imbalance when interpreting model probabilities.
How would you adapt your outreach strategy to revisit merchants that previously declined or showed low interest?
It’s possible that a merchant who declined in the past might now be a good candidate due to changed circumstances. Strategies:
Time-Lagged Reassessment: Set a cooldown period after a merchant declines. Once that period is over, reevaluate them with updated data in the model. Their features, such as revenue growth, may have changed.
Partial Acceptance Clues: If a merchant declined but indicated partial interest (e.g., only for certain customer segments), track these partial signals. Over time, these signals can become stronger acceptance indicators.
Personalized Outreach: For previously declining merchants, adapt your approach. Consider different marketing channels or highlight improved card benefits. A single decline is not always an ultimate “no.”
Edge case: Too many repeated outreaches can damage relationships. Careful planning is needed so that a merchant who has declined multiple times is not spammed. A “decay function” might reduce priority after repeated refusals.
How would you handle very limited training data in specialized merchant categories where you cannot reliably estimate acceptance probability or transaction volume?
In certain niche industries, you might have few data points, making predictions less reliable. Some potential solutions:
Transfer Learning: Leverage a model trained on broader, more data-rich categories and fine-tune it for the niche category with any available subset data.
Hierarchical Models: Group merchants at higher-level categories (e.g., “food service,” “retail”) to borrow statistical strength from broader classes. The model learns global patterns while adjusting them for specific subcategories.
Bayesian Priors: If you only have a handful of data points for the niche category, you could incorporate expert knowledge as a prior for acceptance probability or volume and update with the small data you do have.
Synthetic Data: In extreme cases, you might simulate or generate synthetic data to explore plausible patterns, though you must be cautious with over-trusting artificially generated outcomes.
Edge case: Overfitting can occur quickly when dealing with extremely small samples. You might need to rely more heavily on domain expertise and less on purely data-driven models for those specialized segments.