
ML Interview Q Series: How would you evaluate your clustering of new players without labeled data, based on play styles?

📚 Browse the full ML Interview series here.
Comprehensive Explanation
Clustering is an unsupervised learning technique used to group data points that share similar characteristics. In this scenario, your data points are basketball players, and the goal is to cluster them such that players with comparable skill sets (e.g., shooting ability, defensive skills, athleticism) end up in the same group. However, since there is no labeled data indicating the “true” cluster for each player, you need alternative methods to measure the quality of your clusters.
Internal Cluster Validation Metrics
Internal evaluation methods rely solely on the data and the cluster assignments. These metrics measure aspects like cohesion (similarity of points within each cluster) and separation (distance between different clusters). A few popular internal metrics are:
Sum of Squared Errors (SSE) or Within-Cluster Sum of Squares (WCSS)
K-Means clustering often uses the sum of squared errors (SSE), also known as the within-cluster sum of squares (WCSS), to evaluate how close each data point is to its cluster centroid. A lower SSE indicates tighter clustering (though you must be careful about overfitting when you continuously reduce SSE by increasing the number of clusters).
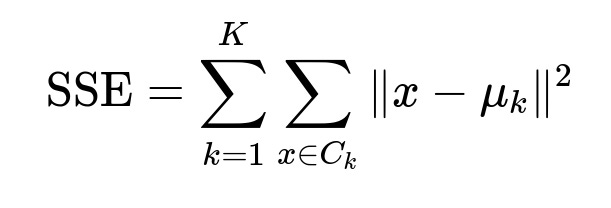
Here, K is the total number of clusters, C_k is the k-th cluster, x is a data point, and mu_k is the centroid of the k-th cluster. The summation of squared distances across all clusters provides a measure of cluster compactness.
Silhouette Coefficient
The silhouette coefficient is often considered a more robust indicator of the separation and cohesion of clusters. For each data point i, define:
a(i) as the average distance of i to all points in the same cluster.
b(i) as the minimum average distance of i to all points in a different cluster.
The silhouette score for point i is computed as:

A silhouette score close to +1 indicates that data point i is appropriately clustered apart from other clusters. A negative value suggests an improper cluster assignment. The overall silhouette coefficient is the average s(i) over all points.
Davies-Bouldin Index
Another common metric is the Davies-Bouldin index, which captures both the average distance within clusters and the distance between clusters. A lower Davies-Bouldin score indicates better clustering structure.
Stability Analysis
A stability-based approach can be helpful: re-run your clustering with different random seeds, or subsample your data to see if the clusters remain relatively consistent. If the same players frequently end up grouped together, this hints at stable, meaningful clusters.
Qualitative Validation with Subject Matter Experts
In many real-world tasks, especially sports analytics, you also rely on domain knowledge to validate whether the clusters make sense:
Are highly specialized shooters ending up together?
Do defensive specialists cluster separately from offensive-minded players?
Does each cluster contain players who share certain measurable traits (height, weight, wingspan, etc.) or intangible skills (court vision, leadership)?
These checks are subjective but extremely valuable, especially when no labeled ground truth exists.
Practical Steps in Python
Below is a simple example demonstrating how to compute the silhouette score for a set of player data. Assume you have numerical features like points per game, rebounds, assists, defensive rating, and so on:
import numpy as np
from sklearn.cluster import KMeans
from sklearn.metrics import silhouette_score

# Sample data: each row could be [points_per_game, rebounds, assists, ...]
X = np.array([
    [25, 5, 6],
    [28, 3, 8],
    [8, 12, 2],
    [10, 9, 3],
    # ... and so on for many players
])

kmeans = KMeans(n_clusters=2, random_state=42)
labels = kmeans.fit_predict(X)

silhouette_avg = silhouette_score(X, labels)
print("Silhouette Score:", silhouette_avg)
You could experiment with different values of K, evaluate SSE or silhouette scores, and compare. The best choice of cluster count depends on how well-separated the clusters look and practical considerations like how many practice groups you realistically want.
Potential Follow-up Questions
How do you decide on the optimal number of clusters?
A common method is the “elbow method,” where you plot SSE against different K values and look for a bend (“elbow”) in the plot. However, in practice, you might blend quantitative approaches (like elbow, silhouette analysis) with domain considerations (e.g., the head coach wants three groups: offense, defense, and all-rounders).
Is there a way to incorporate partial expert labels?
Yes. If domain experts can partially label a small subset (e.g., “These players are defensive specialists”), you can use semi-supervised approaches or external validation metrics on that portion of the data. You can also measure purity or Adjusted Rand Index on the small labeled subset to gauge alignment.
What if the distribution of skills is highly imbalanced?
Imbalanced skill distributions might lead to clusters of vastly different sizes, and some clustering algorithms (like K-Means) can perform poorly on highly imbalanced data. In such a case, you might consider alternative distance metrics or clustering methods (like DBSCAN or hierarchical clustering) that better handle clusters of varied shapes and densities.
How do you handle high-dimensional player data?
Basketball players could have many metrics (e.g., advanced analytics, synergy scores, injuries, etc.). High-dimensionality can lead to distance metrics becoming less meaningful (“curse of dimensionality”). Dimensionality reduction techniques like PCA or t-SNE may help visualize high-dimensional data or focus on the most important features before clustering.
What if you want interpretable clusters for coaches?
Coaches and decision-makers often prefer explanations of why players are grouped together. After clustering, you can analyze feature importance by looking at cluster centroids (e.g., “Cluster 1 is high in three-point attempts and free-throw percentage”). Alternatively, model-agnostic interpretation methods (like SHAP) might offer further insights into which features distinguish clusters.
How do you ensure clusters are actionable for training?
Clusters should reflect differences or similarities that lead to tailored practice regimes. If cluster analyses simply group players by random noise, that is not actionable. Make sure the features you use are strongly correlated with skill sets you want to improve (e.g., passing efficiency, speed, on-ball defense) so that each cluster really highlights distinct strengths and weaknesses.
All these considerations collectively help you verify whether your clustering approach genuinely groups similar basketball players, even when you do not have any pre-labeled data.
Below are additional follow-up questions
How do you handle outliers or unusual players who do not fit into any existing cluster?
Outliers can arise when a player has performance metrics significantly different from the rest, such as an elite scorer with an unprecedented shooting percentage or a versatile star with equally high rebounding and assist numbers. In these cases, traditional clustering algorithms might force that player into a cluster where they do not truly belong, or the algorithm may treat them as their own separate singleton cluster.
One pitfall is that outliers might skew centroids in K-Means, leading to suboptimal cluster formation for everyone else. Likewise, in hierarchical clustering, a single extreme data point can affect the entire linkage process.
To address this, you can:
Use robust distance metrics like Manhattan distance or specialized algorithms like DBSCAN that can discover dense clusters and label outliers separately.
Apply data transformations to reduce the influence of extreme values, such as log-scaling or Winsorizing (capping extreme values) to bring them within a more typical range.
Investigate outliers carefully. Sometimes these unique players are exactly who the team wants to identify and analyze separately, rather than cluster with everyone else.
Real-world subtlety: An “outlier” could actually be the next superstar. You must carefully distinguish between truly noisy data and genuinely exceptional talents.
How can feature selection or engineering impact clustering quality?
The features you choose to include—like points per game, shooting efficiency, rebounds, assists, defensive stats, or more advanced metrics—determine the “shape” of your data in feature space. Poorly chosen features can cluster players based on irrelevant factors or mask the distinctions you care about.
Potential pitfalls include:
Redundant features (e.g., total points and points per minute might be highly correlated), which can overweight certain attributes in distance calculations.
Irrelevant features (e.g., a “shoe brand” feature) that inject noise and reduce the effectiveness of clustering.
Missing out on potentially discriminative features (e.g., advanced synergy metrics, hustle stats) that might lead to more meaningful groupings.
Strategies to handle these challenges:
Perform dimensionality reduction (PCA, autoencoders) to focus on key components and remove noise.
Work with domain experts (coaches, scouts) to identify features that truly differentiate players’ abilities.
Evaluate internal cluster validation metrics (like silhouette score) on different subsets of features to see which combination yields the most stable clusters.
How do you adapt clustering to streaming or evolving data where player performance can change over time?
Player performance data in professional sports can shift rapidly due to injuries, changing roles, or natural progression/regression in skill. Traditional offline clustering might not capture these transitions well if you do not periodically re-run the clustering with updated data.
Key pitfalls include:
Clusters becoming stale: Over time, the player groupings may no longer accurately reflect current performance levels.
Computational overhead: Continuously re-clustering all players from scratch might be expensive if you have very large datasets.
To manage evolving data:
Use incremental or online clustering algorithms (like streaming k-means) that update centroids as new data arrives, avoiding a full retrain.
Monitor performance trends and maintain time-based windows (e.g., last 20 games) to ensure clusters reflect current abilities.
Incorporate a forgetting factor so that older performance metrics have less impact on cluster assignments compared to more recent data.
What if the distance metric used does not capture the similarity aspects you care about?
A critical assumption in clustering is that “similarity” can be measured meaningfully by a chosen distance function, often Euclidean. But for basketball players, Euclidean distance in raw feature space might not fully capture the relationships that matter most to coaches (e.g., intangible leadership, synergy, or situational defensive IQ).
Potential issues:
Certain attributes may need specialized metrics, such as angles for shooting arcs or advanced synergy indexes.
Minkowski or Manhattan distance might capture different aspects of performance better than Euclidean.
Strategies:
Evaluate multiple distance metrics and compare how they affect cluster cohesion. For instance, you might find that Manhattan distance or cosine similarity aligns better with how you conceptualize “similar players.”
Consider advanced similarity measures derived from more complex transformations (e.g., kernel-based similarity if you suspect nonlinear relationships).
How do you ensure that the clusters discovered are stable and not just artifacts of your choice of initialization?
Clustering algorithms like K-Means can yield different results depending on their random initialization or the sequence of data points processed. This can lead to unstable group assignments that erode trust among stakeholders.
To address this:
Run the clustering multiple times with different random seeds or initialization strategies to see if you arrive at consistent groupings.
Use cluster ensemble methods that combine multiple clustering solutions into a consensus result.
Conduct a robustness analysis: add slight variations to the dataset (e.g., bootstrapping or small amounts of noise) and observe whether the clusters remain largely the same.
Real-world subtlety: If your data is inherently noisy, you may find multiple valid ways to partition the players. In these scenarios, domain knowledge becomes critical to decide which partitioning is most meaningful.
How do you deal with categorical or mixed-type attributes in your player data?
Some information about basketball players—like position (guard, forward, center), injury history categories, or playing style descriptions—may be categorical rather than purely numeric. Clustering algorithms that rely on Euclidean distance can be unsuitable when you have a mix of numeric and categorical attributes.
Potential pitfalls:
Unreliable distance calculations when combining continuous features (e.g., points per game) and nominal attributes (e.g., player’s primary position).
Overemphasis of categorical features if not carefully normalized or embedded.
Options for handling mixed-type data:
Convert categorical variables into numerical embeddings (e.g., using one-hot vectors or learned embeddings).
Use algorithms or distance metrics designed for mixed data types (e.g., Gower distance).
Separate the clustering process into numeric vs. categorical subsets, then combine results in a post-processing step where domain experts reconcile the final groupings.
How do you incorporate external factors that may influence performance or skill groupings?
Basketball analytics can be enriched with off-court data: travel schedules, practice regimens, player moods, or synergy with specific teammates. Ignoring these data points might cause clusters to overlook real underlying factors that drive performance patterns.
Pitfalls:
External data is often unstructured or noisy (e.g., social media sentiment, sleep metrics).
Privacy and data access limitations might prevent you from using certain relevant data (like detailed medical information).
Approaches:
Collect and pre-process as many relevant, privacy-compliant features as possible. Then systematically evaluate whether including them yields more coherent or useful clusters.
Use weighting schemes to downplay uncertain data sources and emphasize high-confidence performance metrics.
Engage with sports scientists, psychologists, or coaches to interpret and weigh these external influences properly, ensuring that final clusters make practical sense.